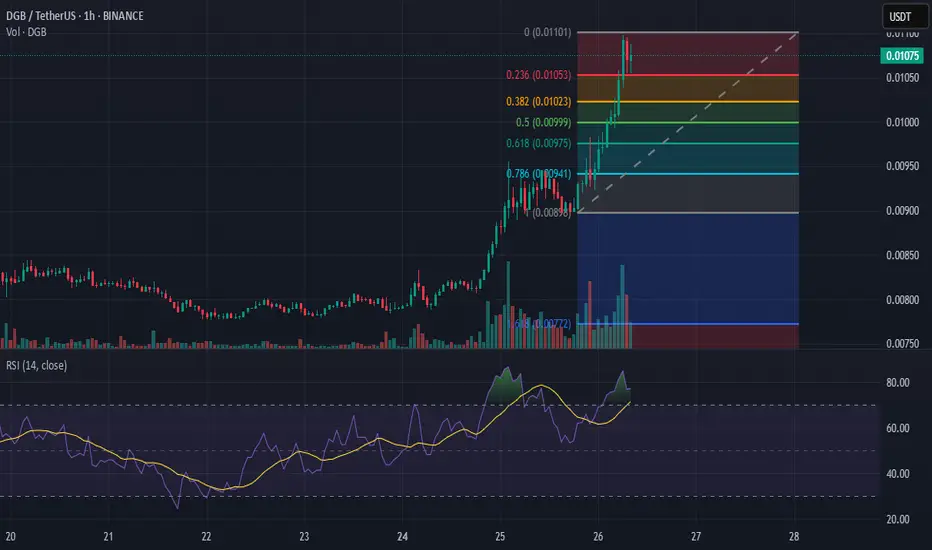
The DGB/USDT pair on Binance is currently in a strong uptrend, as seen in the 1-hour chart. The price has surged, breaking key resistance levels and reaching 0.01078 USDT. The Fibonacci retracement levels suggest potential support at 0.618 (0.00975) and 0.5 (0.00999), which could act as buy zones if a pullback occurs. Additionally, the Relative Strength Index (RSI) is at 77.69, indicating overbought conditions, which might lead to short-term consolidation or correction. Traders should watch for volume confirmations and consider setting a trailing stop-loss to lock in profits while monitoring potential retracement levels.
免責聲明
這些資訊和出版物並不意味著也不構成TradingView提供或認可的金融、投資、交易或其他類型的意見或建議。請在使用條款閱讀更多資訊。
免責聲明
這些資訊和出版物並不意味著也不構成TradingView提供或認可的金融、投資、交易或其他類型的意見或建議。請在使用條款閱讀更多資訊。