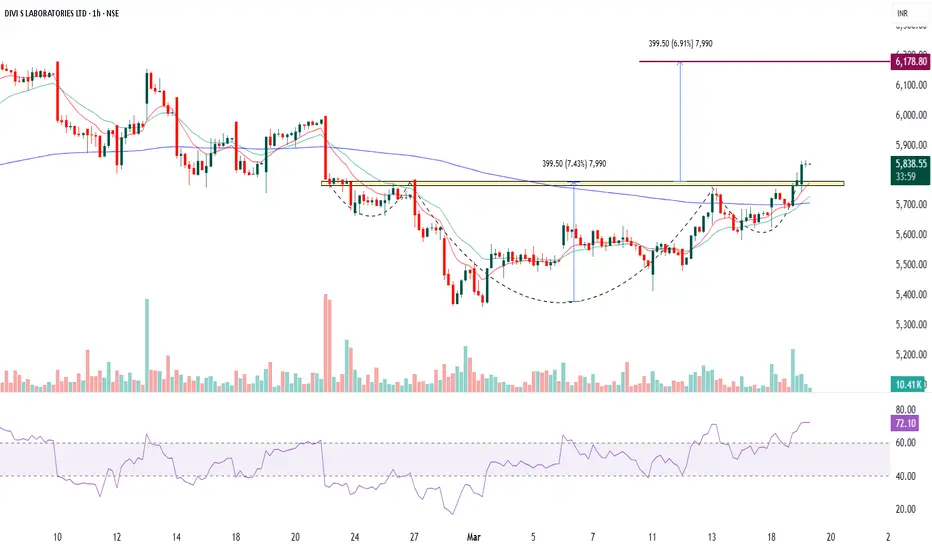
This is a 1-hour chart of DIVI'S LABORATORIES LTD showing an inverted head and shoulders pattern with the following key observations:
1. Pattern Details:
The neckline is around 5830.
The breakout has already happened with good volume, confirming the pattern.
2. EMA Analysis:
10 EMA and 20 EMA are sloping upwards, indicating bullish momentum.
200 EMA is still above the price, suggesting that the broader trend is yet to confirm a full reversal.
3. RSI Analysis:
RSI is at 72.21, which is above 60, indicating strong bullish momentum but nearing the overbought zone.
4. Trade Setup:
Entry: Ideal entry was around the neckline breakout at 5830–5840. However, a retest of the neckline (if it happens) could offer another entry point.
Stop Loss (SL): Below the right shoulder low at around 5650.
Target: Measured move based on the depth of the inverted head is approximately 399.50 points, giving a target around 6178.
Summary:
Entry: 5830–5840 (on breakout or retest)
Stop Loss: 5650
Target: 6178
Risk-to-Reward Ratio: Approximately 2:1
This analysis is for educational purposes only and should not be considered as financial advice. Trading and investing in financial markets involve significant risk, and past performance is not indicative of future results. You should conduct your own research and consult with a qualified financial advisor before making any trading or investment decisions. The author is not responsible for any financial losses or damages that may result from the use of this information.
免責聲明
這些資訊和出版物並不意味著也不構成TradingView提供或認可的金融、投資、交易或其他類型的意見或建議。請在使用條款閱讀更多資訊。