A picture is worth a thousand words.
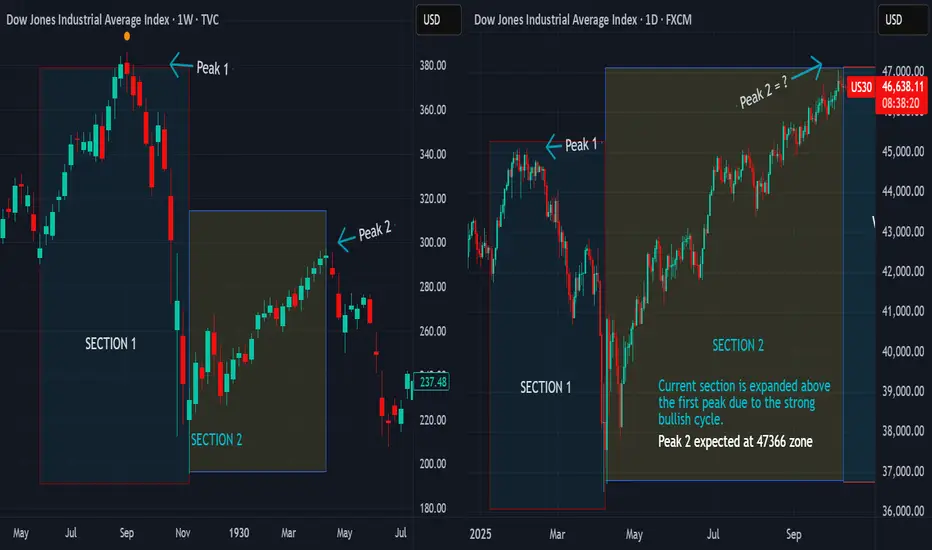
We are comparing the 7-months cycle currently unravelling with its fractal counterparts that have repeated with striking periodicity in the past.
We will compare the trends that follow the completion of the cycle in each of the fractals.
Fractal 1 - (28/06/1965 - 07/02/1966) compared to (07/04/2025 to present)

Fractal 2 (19/10/1987 - 16/07/1990) compared to present

Fractal 3 (07/10/2002 - 16/10/2007) compared to present

In the last two shots, we have represented the entire 5-year cycle so we could see the entire picture for a clearer view. It is interesting to note that the last 7-months cycle is itself a fractal of the entire 5-year cycle.
There are several of them but we would represent only three to make the illustrations simpler.
FOR THE TRENDS THAT FOLLOW THE COMPLETION OF THESE FRACTALS...
April 1930 - July 1932

Feb 1966 - October 1966


July 1990 - October 1990

October 2007 - March 2009

5 out of 5 the market corrected at completion of this cycle. Also by observation the declines are sharp and the recoveries are massive, starting a second wave of hyper-bullish trends
TWO OCCASSIONS WHERE THE CORRECTION WAS PROLONGED


WHATS AHEAD...?
Markets are running into a correction, between October 2025 to February 2026, we expect wide asset classes and global indices to stage a correction. The correction should be quick and sudden which likely would complete in April 2026. A second wave of sharp bullish trend would follow into 2027. We expect a second correction that could start from Feb/March 2027 making a bottom in October 2027. This bottom will be the base for the next 5-year hyper-bullish trend completing the entire 13-year Cycle from 2020.
Follow and check back for the price levels breakdown
Trade safe and good luck.
We are comparing the 7-months cycle currently unravelling with its fractal counterparts that have repeated with striking periodicity in the past.
We will compare the trends that follow the completion of the cycle in each of the fractals.
Fractal 1 - (28/06/1965 - 07/02/1966) compared to (07/04/2025 to present)
Fractal 2 (19/10/1987 - 16/07/1990) compared to present
Fractal 3 (07/10/2002 - 16/10/2007) compared to present
In the last two shots, we have represented the entire 5-year cycle so we could see the entire picture for a clearer view. It is interesting to note that the last 7-months cycle is itself a fractal of the entire 5-year cycle.
There are several of them but we would represent only three to make the illustrations simpler.
FOR THE TRENDS THAT FOLLOW THE COMPLETION OF THESE FRACTALS...
April 1930 - July 1932
Feb 1966 - October 1966
July 1990 - October 1990
October 2007 - March 2009
5 out of 5 the market corrected at completion of this cycle. Also by observation the declines are sharp and the recoveries are massive, starting a second wave of hyper-bullish trends
TWO OCCASSIONS WHERE THE CORRECTION WAS PROLONGED
WHATS AHEAD...?
Markets are running into a correction, between October 2025 to February 2026, we expect wide asset classes and global indices to stage a correction. The correction should be quick and sudden which likely would complete in April 2026. A second wave of sharp bullish trend would follow into 2027. We expect a second correction that could start from Feb/March 2027 making a bottom in October 2027. This bottom will be the base for the next 5-year hyper-bullish trend completing the entire 13-year Cycle from 2020.
Follow and check back for the price levels breakdown
Trade safe and good luck.
相關出版品
免責聲明
這些資訊和出版物並不意味著也不構成TradingView提供或認可的金融、投資、交易或其他類型的意見或建議。請在使用條款閱讀更多資訊。