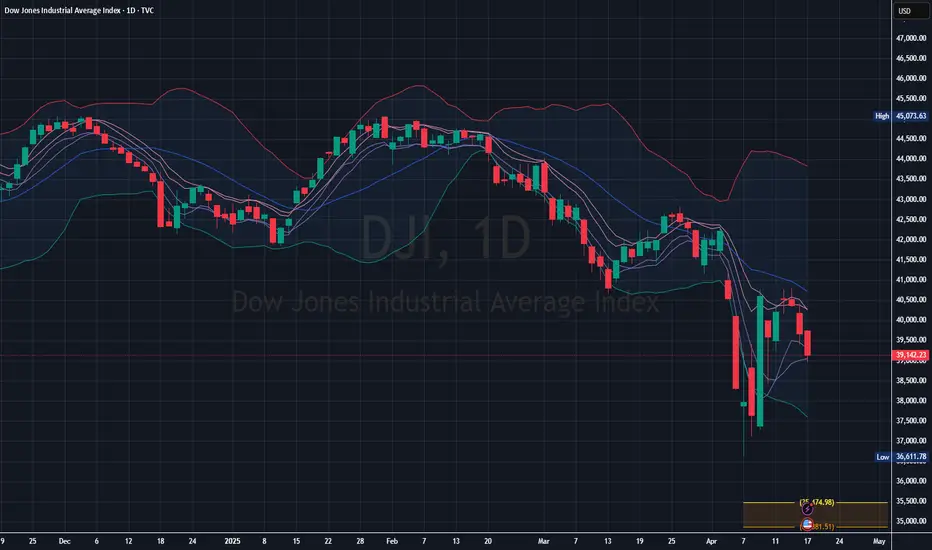
- The price is below the middle line (likely a 20-day moving average) of the Bollinger Bands, which typically signals bearish momentum.
- Recent price action shows a lower high and a lower low pattern, indicating the continuation of a downtrend.
- The candlesticks are mostly red with increasing volume of selling pressure.
- Bands are widening, suggesting increased volatility.
- The price recently pierced the lower Bollinger Band, which often indicates a potential for short-term rebound—but in a strong downtrend, this could also mean acceleration to the downside.
- Key Support Zone : Around 38,000 to 38,500, where previous buying occurred in early April. If broken, further downside to 37,000 is likely.
- Key Resistance Zone : Near 40,500 to 41,000, aligning with the mid-Bollinger Band. This area has been tested and rejected multiple times.
➀➁➂➃➄
免責聲明
這些資訊和出版物並不意味著也不構成TradingView提供或認可的金融、投資、交易或其他類型的意見或建議。請在使用條款閱讀更多資訊。