Have you ever felt the market suddenly caught you off guard, wiping out your capital in an instant?
The Liquidation Data indicator can help manage the fear of liquidation and make smarter trading decisions easier.
Understanding collective market behavior and high-risk zones is key to reducing losses and increasing returns in futures trading.
Hello✌️
Spend 2 minutes ⏰ reading this educational material.
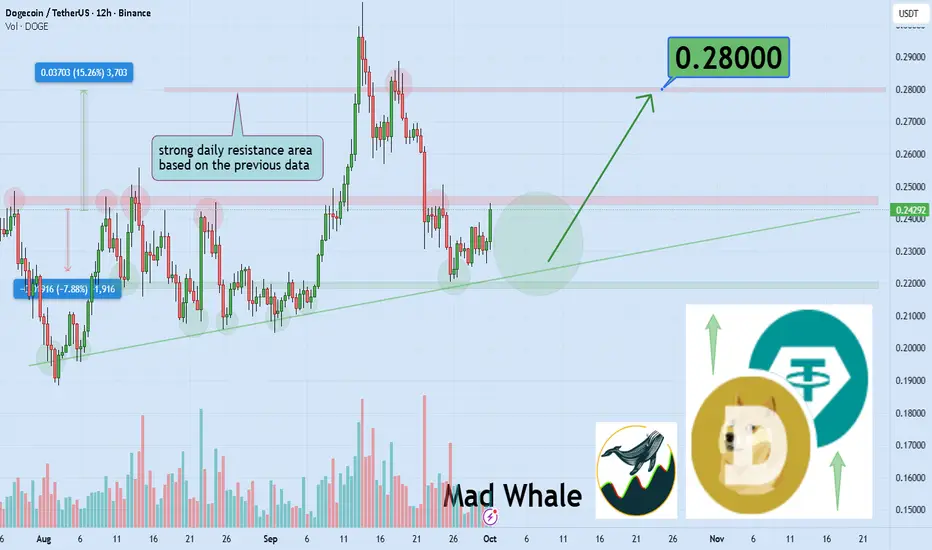
🎯 Analytical Insight on Dogecoin:

 DOGEUSDT is testing a strong daily trendline and key support 📉; holding this level could fuel a 15% upside toward the next resistance near 0.28 🚀.
Now, let's dive into the educational section,
⚡ Market Psychology and Collective Fear
Fear of liquidation often leads traders into wrong positions.
Liquidation clusters act like traps, which whales exploit for profit.
Most losses occur in highly emotional areas of the market.
Collective fear often comes with short-term opportunities, but caution is essential.
Focusing on critical zones prevents FOMO and emotional decisions.
Understanding collective behavior is key to futures trading success.
Collective fear can create short-term golden opportunities.
Increasing trade volume in high-risk areas can lead to losses.
📊 Risk Management Strategies
Combining Liquidation Data with candlestick analysis identifies safer entry points.
Short timeframes are ideal for tracking rapid market movements.
ATR indicates market volatility and helps set appropriate Stop Loss.
VWAP shows average price and market direction.
Alerts notify you when the market reaches risky zones.
Checking multiple timeframes provides a comprehensive risk perspective.
Always have alternative scenarios for your trades.
Reducing trade size in liquidation clusters lowers overall risk.
🔍 Spotting Opportunities Amid Fear
If most traders are getting liquidated in one direction, a price reversal is likely.
Combining Liquidation Data with RSI and MACD can confirm safer entries.
Whale movements and liquidation volume protect you from major losses.
Learning to read Liquidation Data is a must-have skill for every trader.
Identifying high-risk zones improves decision-making and capital management.
Entering positions with over 70% liquidation is extremely risky.
Collective fear can offer short-term opportunities, if approached cautiously.
Focusing on real market data leads to smarter decisions.
🛠️ TradingView Tools and Features
Liquidation Data: Shows clusters of long and short positions at risk of liquidation.
Volume Profile: Analyzes buying and selling pressure and critical levels.
ATR: Measures market volatility for setting Stop Loss.
VWAP: Displays average price and market direction.
Alerts: Notifies when the market reaches high-risk levels.
Multiple Timeframes: Track both short-term movements and overall trends.
Combining these tools allows decisions based on multiple data points.
📝 Summary
Liquidation Data is an essential tool for reducing losses in futures trading.
Collective fear can be risky, but proper analysis can turn it into golden opportunities.
💡 3 Highly Practical Recommendations
Always check liquidation clusters before entering trades and avoid emotional entries.
Use a combination of analytical tools to find safer entry and exit points.
Prioritize risk management; adjust trade size and Stop Loss based on market behavior.
✨ Need a little love!
We pour love into every post your support keeps us inspired! 💛 Don’t be shy, we’d love to hear from you on comments. Big thanks, Mad Whale 🐋
📜Please make sure to do your own research before investing, and review the disclaimer provided at the end of each post.
The Liquidation Data indicator can help manage the fear of liquidation and make smarter trading decisions easier.
Understanding collective market behavior and high-risk zones is key to reducing losses and increasing returns in futures trading.
Hello✌️
Spend 2 minutes ⏰ reading this educational material.
🎯 Analytical Insight on Dogecoin:
Now, let's dive into the educational section,
⚡ Market Psychology and Collective Fear
Fear of liquidation often leads traders into wrong positions.
Liquidation clusters act like traps, which whales exploit for profit.
Most losses occur in highly emotional areas of the market.
Collective fear often comes with short-term opportunities, but caution is essential.
Focusing on critical zones prevents FOMO and emotional decisions.
Understanding collective behavior is key to futures trading success.
Collective fear can create short-term golden opportunities.
Increasing trade volume in high-risk areas can lead to losses.
📊 Risk Management Strategies
Combining Liquidation Data with candlestick analysis identifies safer entry points.
Short timeframes are ideal for tracking rapid market movements.
ATR indicates market volatility and helps set appropriate Stop Loss.
VWAP shows average price and market direction.
Alerts notify you when the market reaches risky zones.
Checking multiple timeframes provides a comprehensive risk perspective.
Always have alternative scenarios for your trades.
Reducing trade size in liquidation clusters lowers overall risk.
🔍 Spotting Opportunities Amid Fear
If most traders are getting liquidated in one direction, a price reversal is likely.
Combining Liquidation Data with RSI and MACD can confirm safer entries.
Whale movements and liquidation volume protect you from major losses.
Learning to read Liquidation Data is a must-have skill for every trader.
Identifying high-risk zones improves decision-making and capital management.
Entering positions with over 70% liquidation is extremely risky.
Collective fear can offer short-term opportunities, if approached cautiously.
Focusing on real market data leads to smarter decisions.
🛠️ TradingView Tools and Features
Liquidation Data: Shows clusters of long and short positions at risk of liquidation.
Volume Profile: Analyzes buying and selling pressure and critical levels.
ATR: Measures market volatility for setting Stop Loss.
VWAP: Displays average price and market direction.
Alerts: Notifies when the market reaches high-risk levels.
Multiple Timeframes: Track both short-term movements and overall trends.
Combining these tools allows decisions based on multiple data points.
📝 Summary
Liquidation Data is an essential tool for reducing losses in futures trading.
Collective fear can be risky, but proper analysis can turn it into golden opportunities.
💡 3 Highly Practical Recommendations
Always check liquidation clusters before entering trades and avoid emotional entries.
Use a combination of analytical tools to find safer entry and exit points.
Prioritize risk management; adjust trade size and Stop Loss based on market behavior.
✨ Need a little love!
We pour love into every post your support keeps us inspired! 💛 Don’t be shy, we’d love to hear from you on comments. Big thanks, Mad Whale 🐋
📜Please make sure to do your own research before investing, and review the disclaimer provided at the end of each post.
Educational plans & Free signals, all in telegram:
👉t.me/madwhalechannel
👉t.me/madwhalechannel
免責聲明
這些資訊和出版物並不意味著也不構成TradingView提供或認可的金融、投資、交易或其他類型的意見或建議。請在使用條款閱讀更多資訊。
Educational plans & Free signals, all in telegram:
👉t.me/madwhalechannel
👉t.me/madwhalechannel
免責聲明
這些資訊和出版物並不意味著也不構成TradingView提供或認可的金融、投資、交易或其他類型的意見或建議。請在使用條款閱讀更多資訊。