DOT/USD Weekly Outlook – Educational Perspective
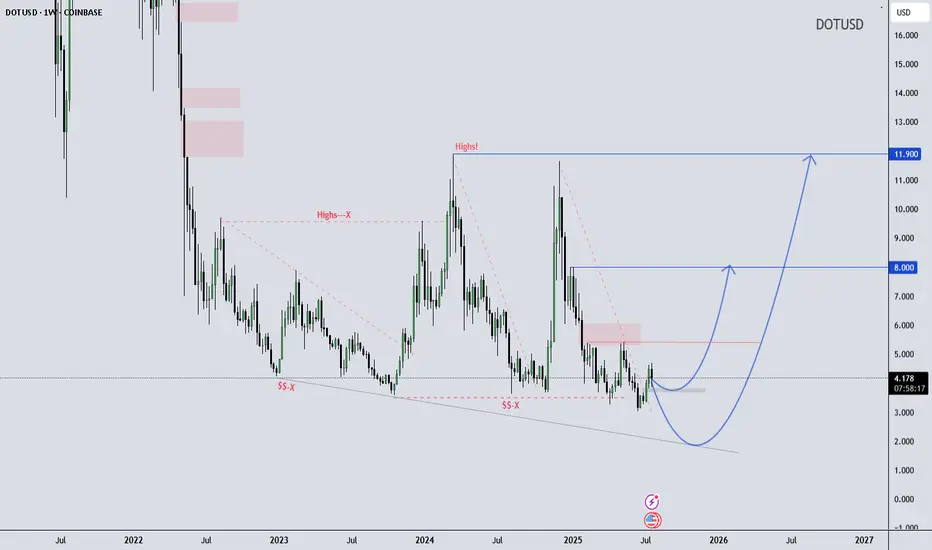
Polkadot (DOT) is trading near the lower boundary of a long-term falling wedge structure, showing early signs of stabilization around the $4.20 support zone. Price has respected this level multiple times, potentially forming a rounded bottom, which often suggests shifting momentum.
If the structure holds, it may continue developing a macro reversal pattern. This kind of formation is typically monitored by swing traders looking for high risk-reward setups in longer timeframes.
Key Technical Levels to Watch:
$8.00 – Mid-range structural resistance
$11.90 – Historical supply / macro pivot zone
This chart is shared for educational purposes only to support market structure learning. Always follow your own analysis and risk management plan.
Wave Trader Pro
Learn & Earn
交易進行
免責聲明
這些資訊和出版物並不意味著也不構成TradingView提供或認可的金融、投資、交易或其他類型的意見或建議。請在使用條款閱讀更多資訊。