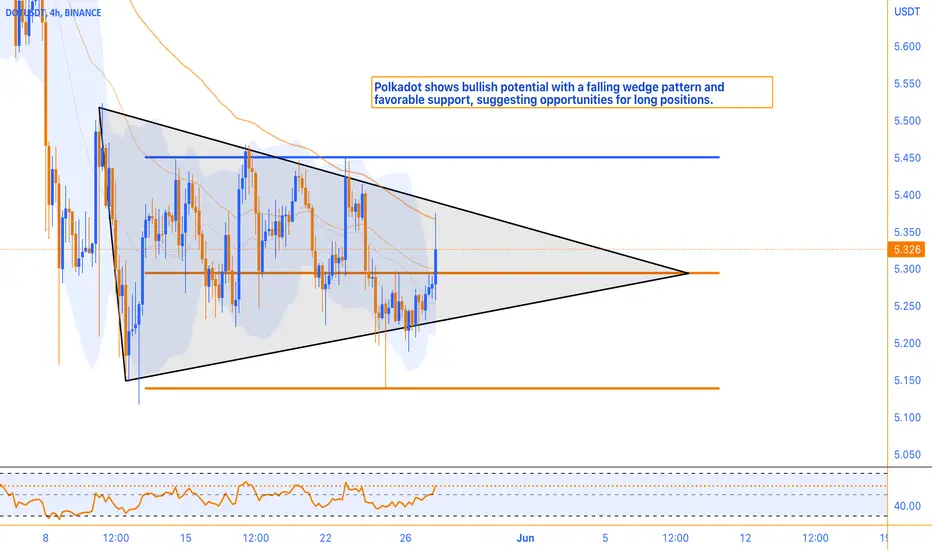
Polkadot is currently being traded within a significant support zone, presenting a favorable trading opportunity. On smaller timeframes, a falling wedge pattern has emerged, indicating the potential for an imminent breakout from this triangular formation. Moreover, the Relative Strength Index (RSI) is currently at the 58 level, suggesting moderate bullish momentum in the stock. This implies that buying pressure is stronger than selling pressure, yet it has not reached an overbought condition. With these factors in mind, traders can consider building a long position at the support level while implementing proper risk management techniques. This analysis indicates a potential upward movement in DOT's price in the near future.
Join our channel:
🔵 t.me/monocoin_public
🟠 t.me/monocoin_public
🔵 t.me/monocoin_public
🟠 t.me/monocoin_public
🔵 t.me/monocoin_public
🟠 t.me/monocoin_public
🔵 t.me/monocoin_public
🟠 t.me/monocoin_public
免責聲明
這些資訊和出版物並不意味著也不構成TradingView提供或認可的金融、投資、交易或其他類型的意見或建議。請在使用條款閱讀更多資訊。
Join our channel:
🔵 t.me/monocoin_public
🟠 t.me/monocoin_public
🔵 t.me/monocoin_public
🟠 t.me/monocoin_public
🔵 t.me/monocoin_public
🟠 t.me/monocoin_public
🔵 t.me/monocoin_public
🟠 t.me/monocoin_public
免責聲明
這些資訊和出版物並不意味著也不構成TradingView提供或認可的金融、投資、交易或其他類型的意見或建議。請在使用條款閱讀更多資訊。