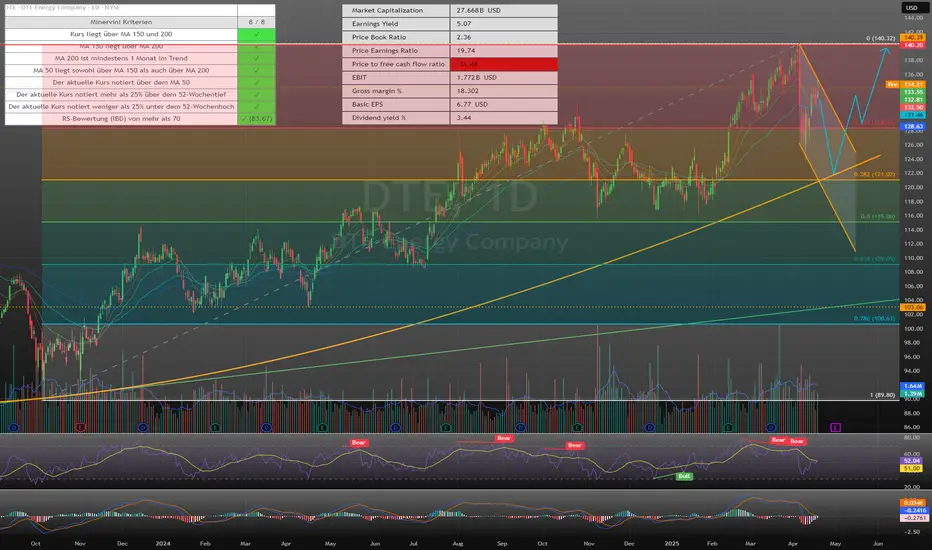
The share is still in an intact upward trend and has experienced a setback after again knocking on the all-time high (ATH).
This setback from the ATH took place with high momentum and led to a clean pullback. However, there has been renewed weakness since then. On the daily chart, there was a return to the area of the previous bottom formation; at the same time, both the RSI and MACD cooled noticeably. The technical picture brightened somewhat with the subsequent rise, but no new buy signals have yet emerged.
On the weekly chart, the RSI is consolidating, while the MACD could generate a possible sell signal in the event of a further setback.
I expect a renewed downward movement towards 124 USD before the current correction at the high can be considered complete and a “handle” formation joins the “cup”.
A breakout from the handle would be a strong buy signal worth waiting for.
免責聲明
這些資訊和出版物並不意味著也不構成TradingView提供或認可的金融、投資、交易或其他類型的意見或建議。請在使用條款閱讀更多資訊。
免責聲明
這些資訊和出版物並不意味著也不構成TradingView提供或認可的金融、投資、交易或其他類型的意見或建議。請在使用條款閱讀更多資訊。