BTC: April blow-off top?
This is not rigorous, but I thought it was interesting.
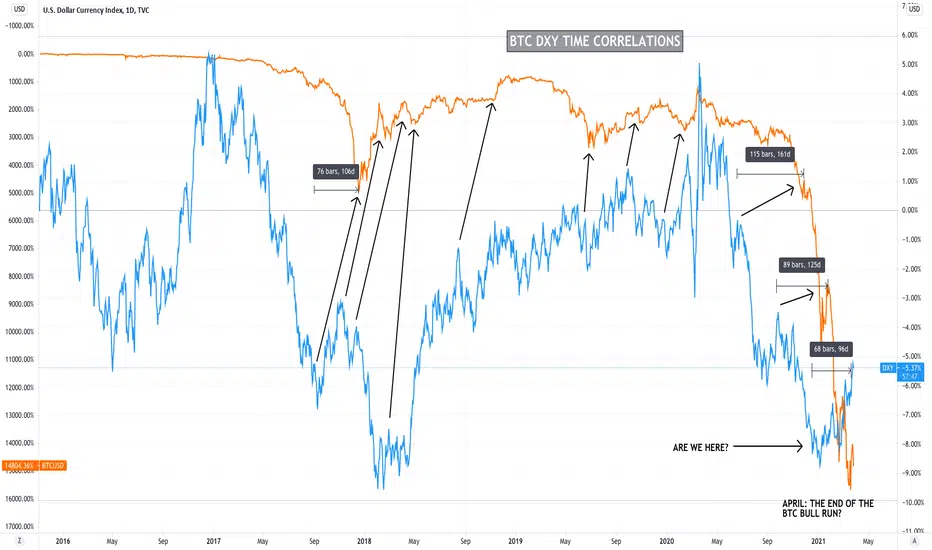
Here I put BTC and DXY on a percentage chart and invert BTC. I was looking for the inverse correlation that exists between them, but I started to notice something else that was interesting.
There is a clear time lag between the two.
This time lag comes and goes: sometimes it appears longer, sometimes shorter.
The March 2020 crash, for example, happened on a much shorter interval. It also appears that the time lag is shortening since Q4 2020.
Also, what is playing out for DXY happens in a much shorter timeframe for BTC, pretty much across the board.
Given what may be suggested in the linked analysis, are we near the final peak of BTC's bull run?
Myriad factors can impact the DXY. But where it is now is already the end of the bull run for BTC. It's like a message from the future. The end already happened. We're just catching up to the future.
If instead of inverting BTC we invert DXY, are we seeing now what BTC's chart will look like in around 96 days?
Look closely at the last major downside impulse for DXY. That last retracement before bottom. Is that where we are with BTC now, just inverted?
Will BTC hit its blow-off top in early April?
Will we already be in a bear market by summer?
AgitationZone | TA-focused cryptocurrency Discord channel discord.gg/atGcaRzz
AgitationZone | TA-focused cryptocurrency Discord channel discord.gg/atGcaRzz
相關出版品
免責聲明
這些資訊和出版物並不意味著也不構成TradingView提供或認可的金融、投資、交易或其他類型的意見或建議。請在使用條款閱讀更多資訊。