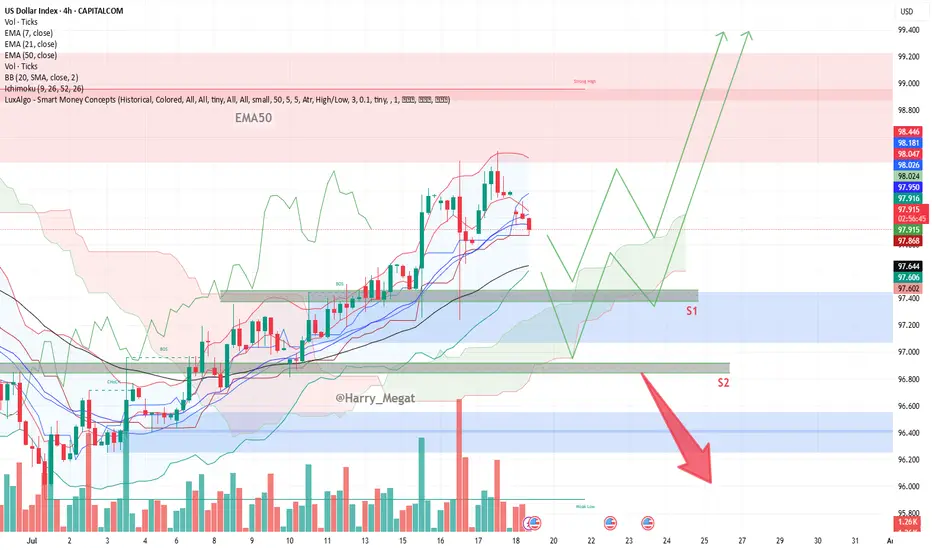
**DXY Chart Outlook: Trend, Support, and Price Objectives (Reworded Analysis)**
**Trend Overview**
* The DXY chart reflects a **clear upward trajectory**, characterized by a sequence of **ascending highs and higher lows** — a classic sign of bullish momentum.
* Currently, the price is **retracing toward the 50-day EMA**, which appears to be holding as **dynamic support**.
* Two important **horizontal support zones** are marked:
* **Support 1 (S1):** \~97.400 (aligned with EMA-50)
* **Support 2 (S2):** \~96.800 (a deeper correction level)
**Projected Price Zones**
* **Near-Term Objective:** **98.800 to 99.000**
* A rebound from the EMA or S1 could send price higher toward this zone, continuing the current bullish structure.
* **Mid-Term Target:** **99.200 to 99.400**
* If the price successfully clears the 99.000 resistance, further bullish continuation could aim for this intermediate target range.
* **Extended Target:** **100.000+**
* A sustained breakout beyond 99.400 could open the path toward **psychological resistance at 100.000**, possibly higher on strong momentum.
**Support Zones to Watch**
* **S1 (97.400):** This level coincides with the 50-day EMA and represents a **first line of defense**.
* **S2 (96.800):** Should the price fall below S1, this secondary level could provide **stronger support** and potential bounce opportunity.
**Risk Management**
* Consider placing a **protective stop** just below S2 — around **96.500** — to safeguard against a potential trend reversal or deeper correction.
**Summary**
* The DXY remains **technically bullish**, with potential upside targets at **98.800**, **99.400**, and eventually **100.000+**.
* Traders can monitor **S1 and S2** for potential entries or trend confirmation.
* A **breakdown below 96.500** would invalidate the bullish setup and warrant caution.
交易進行
The **DXY (US Dollar Index)** is currently pulling back and testing a key **support area between 97.500 and 97.400**, labeled as **S1** on most technical charts. This zone is significant because:1. **Support level**: It has previously held as a floor where buying pressure emerged.
2. **Technical confluence**: This area aligns closely with the **50-period EMA**, which often acts as dynamic support during uptrends.
3. **Trend structure**: DXY has been forming higher highs and higher lows, indicating a bullish trend. A bounce from this level would confirm that the trend remains intact.
If DXY **holds above 97.400**, we could see a continuation toward higher resistance levels like **98.800–99.000**. But if the index **breaks below 97.400**, it could weaken the bullish structure and lead to a deeper correction, potentially toward the **next support at 96.800 (S2)**.
In summary, this is a critical zone—**holding above suggests trend continuation; breaking below could shift momentum short-term.**
交易結束:目標達成
DXY Update:The **bullish breakout scenario played out successfully**, with the **Dollar Index (DXY)** rallying to **98.650**, just shy of the **98.800 target zone**.
Quick Recap of the Bullish Setup
* **Breakout confirmed** above key level (97.400 & EMA zone ✅)
* **Target 1 (98.800)**: Almost reached → **98.650 hit**
* **Strong momentum** supports further upside
Next Bullish Levels to Watch
* **Target 1:** 98.800 (likely to be tested soon)
* **Target 2:** 99.200–99.400 (mid-term zone)
* **Extended Target:** 100.000+ (psychological resistance)
免責聲明
這些資訊和出版物並不意味著也不構成TradingView提供或認可的金融、投資、交易或其他類型的意見或建議。請在使用條款閱讀更多資訊。
免責聲明
這些資訊和出版物並不意味著也不構成TradingView提供或認可的金融、投資、交易或其他類型的意見或建議。請在使用條款閱讀更多資訊。
