🟦 DXY 4H Analysis
📅 August 10, 2025
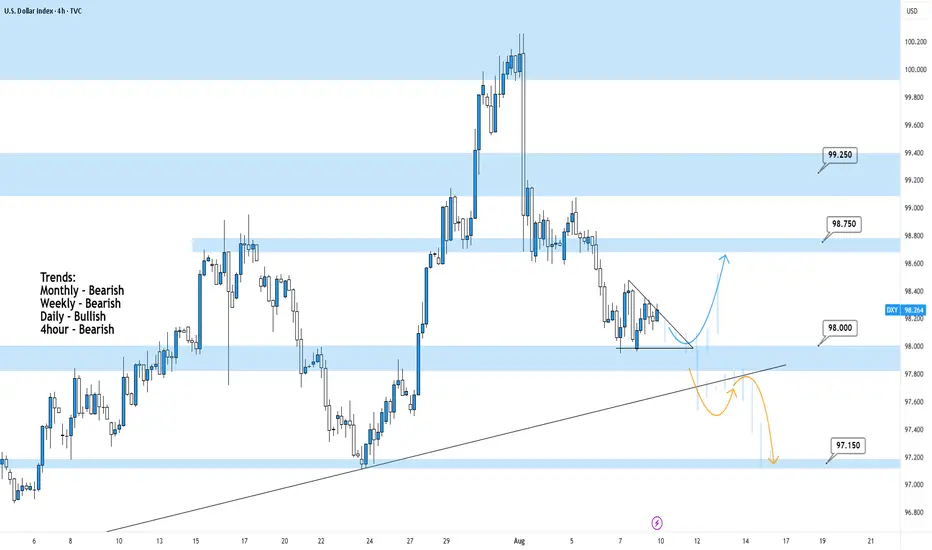
Top-Down Trend Bias:
• Monthly – Bearish
• Weekly – Bearish
• Daily – Bullish
• 4H – Bearish
The Dollar Index is consolidating near the 98.00 support zone after a sustained downtrend on the higher timeframes. Daily shows some bullish relief, but 4H remains under short-term pressure.
🔍 Key Zone: 98.00
This level is a critical decision point, acting as current support and aligning with a trendline from previous swing lows. A break or bounce here will likely set the tone for the next move.
✅ Scenario A: Bullish Breakout (Blue Path)
If price holds above 98.00 and breaks above the current pattern
Look for continuation into 98.75
Extended target: 99.25 resistance
This would be a countertrend move on the higher timeframes but aligns with the daily bullish structure.
⚠️ Scenario B: Bearish Breakdown (Orange Path)
If price breaks and closes below 98.00
Watch for retest rejection to confirm
Target: 97.15 support
This setup aligns with the overall HTF bearish bias and would signal downside continuation.
🧠 Final Notes
• 98.00 is the line in the sand for short-term direction
• Blue path is valid only on confirmed breakout; orange path is trend aligned
• Let price action at this key level confirm before committing
📅 August 10, 2025
Top-Down Trend Bias:
• Monthly – Bearish
• Weekly – Bearish
• Daily – Bullish
• 4H – Bearish
The Dollar Index is consolidating near the 98.00 support zone after a sustained downtrend on the higher timeframes. Daily shows some bullish relief, but 4H remains under short-term pressure.
🔍 Key Zone: 98.00
This level is a critical decision point, acting as current support and aligning with a trendline from previous swing lows. A break or bounce here will likely set the tone for the next move.
✅ Scenario A: Bullish Breakout (Blue Path)
If price holds above 98.00 and breaks above the current pattern
Look for continuation into 98.75
Extended target: 99.25 resistance
This would be a countertrend move on the higher timeframes but aligns with the daily bullish structure.
⚠️ Scenario B: Bearish Breakdown (Orange Path)
If price breaks and closes below 98.00
Watch for retest rejection to confirm
Target: 97.15 support
This setup aligns with the overall HTF bearish bias and would signal downside continuation.
🧠 Final Notes
• 98.00 is the line in the sand for short-term direction
• Blue path is valid only on confirmed breakout; orange path is trend aligned
• Let price action at this key level confirm before committing
免責聲明
The information and publications are not meant to be, and do not constitute, financial, investment, trading, or other types of advice or recommendations supplied or endorsed by TradingView. Read more in the Terms of Use.
免責聲明
The information and publications are not meant to be, and do not constitute, financial, investment, trading, or other types of advice or recommendations supplied or endorsed by TradingView. Read more in the Terms of Use.