DXY Weekly
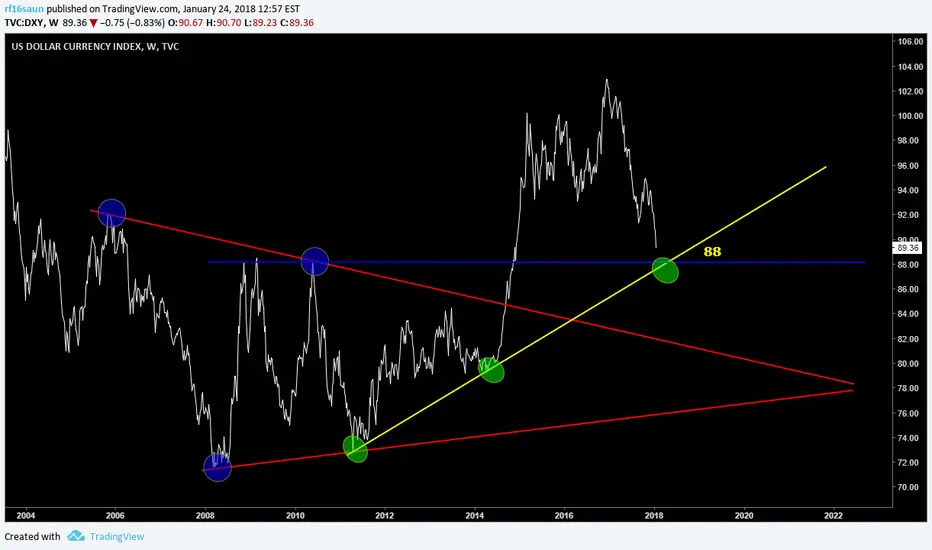
Price is nearing a very important price point 88, after breaking the massive symmetrical in 2014, it never had a pullback near to the triangle except for last year's fall which is ongoing. Pre-break out of the symmetrical triangle a well respected uptrend line was formed in 2011. After more than three and half years price is finally coming to re-test this six-year long uptrend line, massive Fib confluence, support and uptrend line converge around 88. Break of this area will leave a potential to retest the triangle 80 and if the uptrendline is respected then a potential move towards @110. If price fail to hold the traingle then the equal move down from 2002 will break DXY to 54 range (Damn). Mind you long term chart of this is bearish and this fall (From 2017)is after perfect retest of 61.8% retracement of 2002 high.
Price is nearing a very important price point 88, after breaking the massive symmetrical in 2014, it never had a pullback near to the triangle except for last year's fall which is ongoing. Pre-break out of the symmetrical triangle a well respected uptrend line was formed in 2011. After more than three and half years price is finally coming to re-test this six-year long uptrend line, massive Fib confluence, support and uptrend line converge around 88. Break of this area will leave a potential to retest the triangle 80 and if the uptrendline is respected then a potential move towards @110. If price fail to hold the traingle then the equal move down from 2002 will break DXY to 54 range (Damn). Mind you long term chart of this is bearish and this fall (From 2017)is after perfect retest of 61.8% retracement of 2002 high.
免責聲明
這些資訊和出版物並不意味著也不構成TradingView提供或認可的金融、投資、交易或其他類型的意見或建議。請在使用條款閱讀更多資訊。