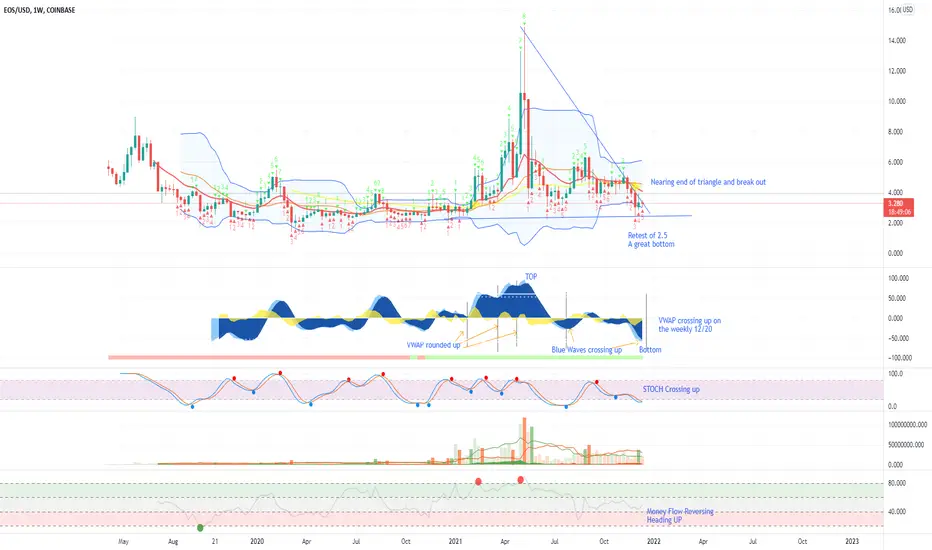
Most of my notes are in the chart. This chart is on EOS 1 Week Timeframe.
Almost every time the VWAP rounds up on CIPHER B indicator on the weekly timeframe EOS 2Xs over two weeks time. It is currently near a bottom on the CIPHER blue waves. Money flow is heading up. Its nearing the end of the triangle. It re-tested 2.48 and bounced.
I bought in at 3.27.
This is not financial advice. BTC is currently struggling.
免責聲明
這些資訊和出版物並不意味著也不構成TradingView提供或認可的金融、投資、交易或其他類型的意見或建議。請在使用條款閱讀更多資訊。
免責聲明
這些資訊和出版物並不意味著也不構成TradingView提供或認可的金融、投資、交易或其他類型的意見或建議。請在使用條款閱讀更多資訊。
