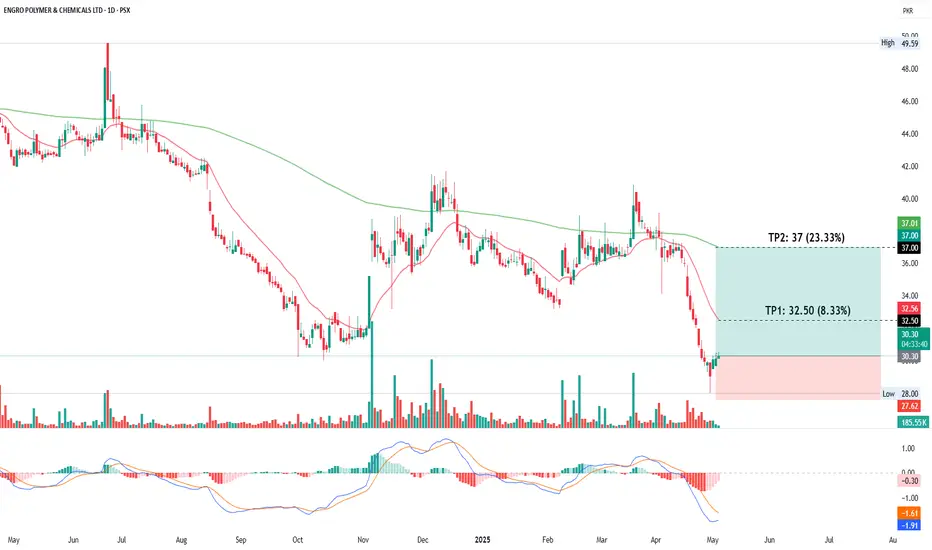
The daily chart of EPCL indicates a potential bullish reversal. The price recently rebounded from a low near 28 and is now trading at 30.50, showing signs of recovery. The MACD indicator is on the verge of a bullish crossover, suggesting increasing upward momentum. The immediate target (TP1) is 32.50, which aligns with the 20-day EMA, while the second target (TP2) is set at 37.00, corresponding to the 200-day EMA. These levels represent 8.33% and 23.33% potential gains, respectively, and may serve as key resistance levels in the short to medium term.
免責聲明
這些資訊和出版物並不意味著也不構成TradingView提供或認可的金融、投資、交易或其他類型的意見或建議。請在使用條款閱讀更多資訊。
免責聲明
這些資訊和出版物並不意味著也不構成TradingView提供或認可的金融、投資、交易或其他類型的意見或建議。請在使用條款閱讀更多資訊。