Multi-Timeframe Market Structure Analysis
Weekly Trend Overview
The E-mini S&P 500 (ES) continues to reflect a robust bullish trend on the weekly chart, characterized by a series of higher highs and higher lows. The most recent swing low is situated in the mid-6,500s, while prices are currently testing the previous weekly high zone around the high-6,800s, accompanied by a labeled weak high band overhead.
In terms of market positioning, prices reside firmly in the upper half of the annual range, trading within a premium supply band rather than at a discount. Momentum indicators are showing signs of a slowdown, with the weekly oscillator retreating from overbought conditions and gently sloping downward, even as prices hold near their highs. This situation exemplifies early-stage negative momentum divergence, suggesting that while the overarching trend remains intact, any upside progress is now slower and increasingly susceptible to pullbacks.
The structural bull market on the weekly timeframe is still valid, but the current price action falls into a costly zone, placing the onus on buyers to maintain upward momentum.
Daily Trend Analysis
Following a notable decline in November from the all-time high, ES established a higher low around the mid-6,500s, coinciding with a key extension bundle. Subsequently, it rebounded through the mid-6,700s, successfully reclaiming the essential daily midrange. The latest price action reflects a sequence of lower lows (LL), higher lows (HL), and a higher high, signaling a short-term bullish trend within a broader sideways pattern just beneath the recent highs.
The active daily range is delineated between 6,650 and 6,900, with current trading situated in the upper third. The daily momentum oscillator has sharply ascended from oversold territory and sits comfortably in the 60s—nearing overbought conditions but not quite there yet.
The daily trend indicates an uptrend initiated from a higher low, now testing resistance levels. Trend-following participants are positioned long, though late entrants may find themselves crowded near the upper edge of the trading range.
Four-Hour Structural Insights
The 4-hour chart reveals a strong reversal from a low around 6,525, where price structure has formed a clean stair-step of higher highs and higher lows. The latest 4-hour higher low rests in the high-6,700s. The recent impulse leg from this higher low has driven prices into the prior week's high and supply band near the high-6,800s. Observations indicate that candles are narrowing while wicks are extending, typically signaling an impending maturation of the current price leg.
While this remains largely an impulse move rather than a complete correction, the risk-to-reward ratio for entering fresh long positions at these levels appears unfavorable without a corrective pullback.
The 4-hour trend is decidedly bullish, yet this leg is maturing. A retracement toward the last observed higher low band in the high-6,700s would be both typical and healthy for the ongoing progression.
One-Hour Intraday Context
The 1-hour chart indicates a prolonged consolidation phase in the low-to-mid-6,800s, succeeded by a breakout thrust toward the prior week’s high. Recent micro-structural developments show small higher highs with diminished follow-through into the resistance zone. The emergence of upper wicks on the 1-hour candles suggests we're in the later stages of this move which originated from Friday’s New York low.
For intraday traders, entering new positions at this stage carries poor asymmetry. Strategies may involve either capitalizing on a potential exhaustion spike higher or considering buys only after a reset lower.
The intraday price leg is nearing maturity; anticipate either a minor mean reversion back into the breakout base or a final overshoot into the overhead extension band, followed by a more substantial pause.
Oscillator Insights on Weekly and Daily Timeframes
On the weekly front, the oscillator is rolling over from overbought levels, keeping prices near previous highs. While this in itself does not constitute a sell signal, it does imply that any additional advances will likely become increasingly challenging and volatile. Conversely, the daily oscillator remains robust, exhibiting positive momentum and trending upwards, although already sitting at mid-to-high levels. While there remains potential for one more uptick toward resistance, the risk of a sharp downturn looms larger should market news or flows fail to meet expectations.
Bottom Line: The primary timeframe indicators (weekly/daily) maintain a bullish outlook, while the active swings on the 4-hour and 1-hour charts are showing maturity and extension into resistance. The upcoming trading week will likely focus on navigating this late-stage upswing, either through fading exhaustion at the range's peak or by purchasing on controlled dips into well-defined demand zones.
Market Overview: Key Levels and Dynamics
Trend Boundary Analysis: 6,780 Area
The pivotal threshold for discerning between a healthy pullback and a significant trend reversal lies around the 6,780 mark. A sustained daily close below this level—specifically under S2 and near the last daily higher low—would signal a transition from what appears to be a “healthy pullback in an uptrend” to a more pronounced “daily correction.” In contrast, remaining above 6,780 allows for the interpretation of pullbacks as buyable dips into existing demand. However, should the market close below this threshold with consistent acceptance evidenced by multiple 4-hour closes and significant volume, the prevailing sentiment would shift towards anticipating a larger trading range or an early trend change.
Volatility Metrics Overview
The volatility index (VIX) closed at approximately 16.35 on Friday, a considerable drop from the mid-20s earlier in the month, indicating a low-to-moderate equity volatility regime. The options market appears relaxed rather than panicked. The VIX term structure has returned to contango, with the front month trading cheaper than the back month, supporting a risk-on environment without veering into euphoria. On the treasury front, the MOVE index remains elevated at around 69, having retreated from mid-80s spikes earlier in November, signaling that rate volatility has cooled yet remains high compared to pre-2022 standards.
The recent readings suggest that the fear that overshadowed the mid-month selloff has largely been priced out. Both equity and rate volatility have begun to mean-revert, typically favoring range trading and a more orderly trend rather than severe sell-offs. However, it’s important to note that the current state makes protective measures inexpensive, hinting that abrupt corrections could emerge unexpectedly.
Options Positioning Dynamics
The total put/call ratio is hovering around 0.70 for the latest session, suggesting a slight tilt towards puts relative to longer-term averages. The equity put/call ratio stands at about 0.44, indicating a bullish, call-heavy sentiment among traders, predominantly in single-name options. The 10-day moving average of the put/call ratio is roughly 0.92, slightly below neutral, indicating some short-term complacency, although not excessively stretched.
The SKEW index has stabilized around 143, down from the 160s a year ago but still above the traditional baseline of 120-130. This points to an inclination for tail hedging that is present but not extreme. Given the mid-teen VIX levels and a neutral total put/call ratio combined with a low equity put/call ratio, it is reasonable to deduce that dealers are likely not heavily short gamma at current spots. They may be positioned closer to long or flat gamma within the 6,750-6,900 range, which generally dampens intraday volatility and suggests a tendency toward mean-reversion. Conversely, movement outside this band—specifically above 6,950 or below 6,730—could alter the gamma positioning and pave the way for more significant directional shifts.
Market Breadth and Internal Strength
The S&P 500 concluded the week with a modest 0.5% gain on Friday, reflecting small gains throughout the month, while the Nasdaq faced a 1.5% decline, primarily driven by weakness in large technology stocks. The S&P 500 remains above both its 50-day and 200-day moving averages, having reclaimed the 50-day line last week after an earlier dip, suggesting renewed market participation beyond just a few mega-cap stocks.
Sector performance varied notably, with technology facing headwinds throughout November—most notably from AI-linked companies—while sectors such as energy, consumer cyclicals, and certain areas of healthcare and financials saw positive movements towards month-end. Despite an earlier warning from indicators like the McClellan Oscillator suggesting internal weaknesses, the recent rebound has begun to improve breadth. However, concerns linger that this rally might be more fragile than typical broad-based advances, given its rotational and choppy nature.
Credit and Funding Landscape
The high-yield index (HYG) hovers around 81, near recent highs, indicating generally favorable credit conditions as it has progressively climbed through November. High-yield spreads are tightening relative to recent standards, reinforcing a “risk-on” attitude within credit markets. There are no apparent signs of acute funding stress; previous operational disruptions in futures markets were not indicative of systemic issues.
Currently, credit markets are not signaling alarms. As long as HYG remains above approximately 79, equity dips are more likely to be viewed as buying opportunities rather than triggers for widespread liquidation.
Sentiment and Investor Positioning
In the latest AAII survey, the bull-bear spread stands at around -11%, indicating a modest bearish sentiment, with bears outnumbering bulls by approximately 11 percentage points—below the historical mean of +6%. Conversely, the low equity put/call ratio suggests that traders are actively pursuing upside positions in individual equities.
In summary, while survey data points to cautious investor sentiment, options markets illustrate a preference for call buying and a diminishment of fear. This dichotomy often results in uneven uptrends with the potential for sudden pullbacks when complacency is inevitably challenged.
Global Risk Sentiment and Cross-Asset Overview
In the cryptocurrency sector, Bitcoin has stabilized around 90-91k following a significant correction earlier in the month, with modest recovery observed in the past week. This development underscores a risk-on atmosphere among investors.
Macro and data-calendar context
• The coming week (Dec 1–5) is busy but not as pivotal as the mid-December CPI/Payrolls
• Key events:
• Monday: ISM Manufacturing and construction spending.
• Tuesday: JOLTS job openings.
• Wednesday: ADP employment and ISM Services, plus several PMI and industrial-production figures.
• Thursday: Challenger job cuts, weekly jobless claims, and trade balance.
• Friday: Critically, the delayed PCE and core PCE inflation data for September, pushed back by the recent government shutdown.
• Fed communication: The Fed is effectively entering its pre-meeting quiet period; Powell’s upcoming speech is one of the last major remarks before the December meeting.
Macro narrative: Markets are leaning heavily toward another Fed rate cut in December and a benign inflation path.  Given that, negative surprises in PCE or labor data could trigger a sharp repricing.
The late-November rally appears to be a recalibration of positioning and sentiment following a mid-month scare within the tech sector, rather than a direct response to any significant data shock. This week's major macroeconomic event is Friday's PCE report; other data releases are expected to influence intraday fluctuations rather than alter the overarching trend.
Scenario Analysis and Probabilities
These scenarios represent probabilistic outcomes rather than certainties.
Primary Path — “Controlled Grind with Dip-Buying” (Approximately 50%)
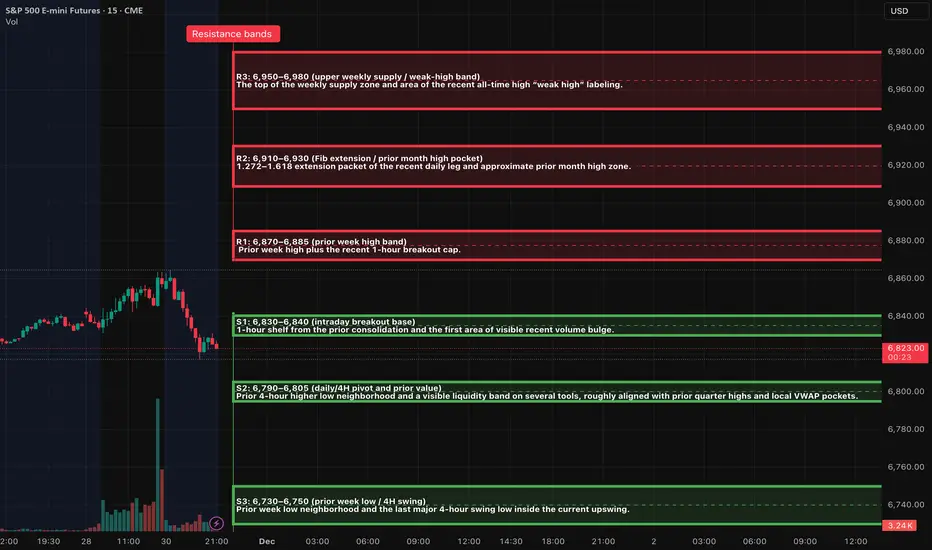
As we enter Monday, expect a modest pullback from Friday's late gains, with overnight Globex trading projected to fluctuate between 6,820 and 6,880. Early in the week, the market may test support levels S1 (6,830–6,840) or potentially S2 (6,790–6,805), ultimately leading to renewed attempts to breach resistance at R1 and possibly R2. By the week’s end, prices are anticipated to oscillate within a broad range of 6,790–6,930 ahead of Friday's PCE announcement, with only temporary moves outside this zone.
Confirmation Criteria: This path will be validated if we observe rejections below the 6,780 level holding firm on a closing basis, accompanied by repeated failures of sellers to maintain downward pressure beneath S2.
Bear-Extension Path — “Deeper Reset Before Year-End” (Approximately 30%)
This scenario is triggered by a failed breakout above R1/R2 early in the week, coupled with a significant intraday reversal and a decisive 4-hour close beneath S2 and potentially S3. Initial price action may feature a spike into the 6,910–6,930 range followed by swift sell-offs, leading to a rapid retreat back through S1 and S2, particularly if the PCE data comes in above expectations or labor statistics surprise on the upside, prompting a re-assessment of potential Fed rate cuts.
Target Area: The initial aim would be the 6,650–6,700 region (near S4), with the possibility of a complete reversal down toward the more robust 6,620–6,650 band.
Confirmation Criteria: Continuous acceptance below approximately 6,730 on a 4-hour basis, combined with a daily close under the 6,780 threshold, would indicate a return to the narrative of a higher low for November.
Bull-Surprise Path — “Breakaway Into New Highs” (Approximately 20%)
This scenario is set in motion by a clear 4-hour and subsequent daily close above R2 and R3, driven by exceptionally benign PCE numbers and a supportive stance from the Federal Reserve. Initial price action should reflect minimal pullback in the early part of the week, steadily climbing past R1 and R2, ultimately resulting in a trend day that aggressively squeezes shorts above the 6,950 mark.
Target Area: The market will likely gravitate toward the extension zone of 7,050–7,100.
Confirmation Criteria: Sustained trading above 6,930 without significant reversals, robust market breadth, and a VIX that remains comfortably anchored in the mid-teens or lower will serve as key indicators for this bullish outlook.
Two A++ setups for the week
A++ Setup 1: Rejection short from R2
Fade spike into 6,910-6,930; Entries, SL, TPs
Entry zone: 6,890–6,900 on the first clean 1-minute pullback after the 5-minute lower high.
Initial stop: Above the rejection high plus a small buffer; planning number ~6,935. That is about 35-45 points of risk if filled near 6,895-6,900; refine to the actual 15-minute wick when it forms.
TP1: 6,830-6,840 (S1 / breakout base). From a 6,895 entry, that is roughly 55–65 points, giving at least 1.3-1.5R with the conservative stop and significantly more if the wick is tighter.
TP2: 6,790-6,805 (S2 demand pocket).
TP3 (runner): 6,730-6,750 (S3), only if tape is heavy (e.g., PCE or data shock).
A++ Setup 2: Continuation long from S2
ES Long (A++) - Buy reclaim of 6,790–6,805; Entries, SL, TPs
Entry zone: 6,805-6,815 on the first 1-minute higher-low after the 5-minute confirmation.
Initial stop: A few points below the spike low; planning number ~6,780, which gives about 25–35 points of risk.
TP1: 6,870-6,885 (R1 / prior week high band). From a 6,810 entry, that is roughly 60–75 points, delivering comfortably more than 2R with the planned stop.
TP2: 6,910-6,930 (R2 extension band).
TP3 (runner): 6,950-6,980 (R3 / upper weekly supply) if PCE and flows are supportive.
Good Luck !!!
Weekly Trend Overview
The E-mini S&P 500 (ES) continues to reflect a robust bullish trend on the weekly chart, characterized by a series of higher highs and higher lows. The most recent swing low is situated in the mid-6,500s, while prices are currently testing the previous weekly high zone around the high-6,800s, accompanied by a labeled weak high band overhead.
In terms of market positioning, prices reside firmly in the upper half of the annual range, trading within a premium supply band rather than at a discount. Momentum indicators are showing signs of a slowdown, with the weekly oscillator retreating from overbought conditions and gently sloping downward, even as prices hold near their highs. This situation exemplifies early-stage negative momentum divergence, suggesting that while the overarching trend remains intact, any upside progress is now slower and increasingly susceptible to pullbacks.
The structural bull market on the weekly timeframe is still valid, but the current price action falls into a costly zone, placing the onus on buyers to maintain upward momentum.
Daily Trend Analysis
Following a notable decline in November from the all-time high, ES established a higher low around the mid-6,500s, coinciding with a key extension bundle. Subsequently, it rebounded through the mid-6,700s, successfully reclaiming the essential daily midrange. The latest price action reflects a sequence of lower lows (LL), higher lows (HL), and a higher high, signaling a short-term bullish trend within a broader sideways pattern just beneath the recent highs.
The active daily range is delineated between 6,650 and 6,900, with current trading situated in the upper third. The daily momentum oscillator has sharply ascended from oversold territory and sits comfortably in the 60s—nearing overbought conditions but not quite there yet.
The daily trend indicates an uptrend initiated from a higher low, now testing resistance levels. Trend-following participants are positioned long, though late entrants may find themselves crowded near the upper edge of the trading range.
Four-Hour Structural Insights
The 4-hour chart reveals a strong reversal from a low around 6,525, where price structure has formed a clean stair-step of higher highs and higher lows. The latest 4-hour higher low rests in the high-6,700s. The recent impulse leg from this higher low has driven prices into the prior week's high and supply band near the high-6,800s. Observations indicate that candles are narrowing while wicks are extending, typically signaling an impending maturation of the current price leg.
While this remains largely an impulse move rather than a complete correction, the risk-to-reward ratio for entering fresh long positions at these levels appears unfavorable without a corrective pullback.
The 4-hour trend is decidedly bullish, yet this leg is maturing. A retracement toward the last observed higher low band in the high-6,700s would be both typical and healthy for the ongoing progression.
One-Hour Intraday Context
The 1-hour chart indicates a prolonged consolidation phase in the low-to-mid-6,800s, succeeded by a breakout thrust toward the prior week’s high. Recent micro-structural developments show small higher highs with diminished follow-through into the resistance zone. The emergence of upper wicks on the 1-hour candles suggests we're in the later stages of this move which originated from Friday’s New York low.
For intraday traders, entering new positions at this stage carries poor asymmetry. Strategies may involve either capitalizing on a potential exhaustion spike higher or considering buys only after a reset lower.
The intraday price leg is nearing maturity; anticipate either a minor mean reversion back into the breakout base or a final overshoot into the overhead extension band, followed by a more substantial pause.
Oscillator Insights on Weekly and Daily Timeframes
On the weekly front, the oscillator is rolling over from overbought levels, keeping prices near previous highs. While this in itself does not constitute a sell signal, it does imply that any additional advances will likely become increasingly challenging and volatile. Conversely, the daily oscillator remains robust, exhibiting positive momentum and trending upwards, although already sitting at mid-to-high levels. While there remains potential for one more uptick toward resistance, the risk of a sharp downturn looms larger should market news or flows fail to meet expectations.
Bottom Line: The primary timeframe indicators (weekly/daily) maintain a bullish outlook, while the active swings on the 4-hour and 1-hour charts are showing maturity and extension into resistance. The upcoming trading week will likely focus on navigating this late-stage upswing, either through fading exhaustion at the range's peak or by purchasing on controlled dips into well-defined demand zones.
Market Overview: Key Levels and Dynamics
Trend Boundary Analysis: 6,780 Area
The pivotal threshold for discerning between a healthy pullback and a significant trend reversal lies around the 6,780 mark. A sustained daily close below this level—specifically under S2 and near the last daily higher low—would signal a transition from what appears to be a “healthy pullback in an uptrend” to a more pronounced “daily correction.” In contrast, remaining above 6,780 allows for the interpretation of pullbacks as buyable dips into existing demand. However, should the market close below this threshold with consistent acceptance evidenced by multiple 4-hour closes and significant volume, the prevailing sentiment would shift towards anticipating a larger trading range or an early trend change.
Volatility Metrics Overview
The volatility index (VIX) closed at approximately 16.35 on Friday, a considerable drop from the mid-20s earlier in the month, indicating a low-to-moderate equity volatility regime. The options market appears relaxed rather than panicked. The VIX term structure has returned to contango, with the front month trading cheaper than the back month, supporting a risk-on environment without veering into euphoria. On the treasury front, the MOVE index remains elevated at around 69, having retreated from mid-80s spikes earlier in November, signaling that rate volatility has cooled yet remains high compared to pre-2022 standards.
The recent readings suggest that the fear that overshadowed the mid-month selloff has largely been priced out. Both equity and rate volatility have begun to mean-revert, typically favoring range trading and a more orderly trend rather than severe sell-offs. However, it’s important to note that the current state makes protective measures inexpensive, hinting that abrupt corrections could emerge unexpectedly.
Options Positioning Dynamics
The total put/call ratio is hovering around 0.70 for the latest session, suggesting a slight tilt towards puts relative to longer-term averages. The equity put/call ratio stands at about 0.44, indicating a bullish, call-heavy sentiment among traders, predominantly in single-name options. The 10-day moving average of the put/call ratio is roughly 0.92, slightly below neutral, indicating some short-term complacency, although not excessively stretched.
The SKEW index has stabilized around 143, down from the 160s a year ago but still above the traditional baseline of 120-130. This points to an inclination for tail hedging that is present but not extreme. Given the mid-teen VIX levels and a neutral total put/call ratio combined with a low equity put/call ratio, it is reasonable to deduce that dealers are likely not heavily short gamma at current spots. They may be positioned closer to long or flat gamma within the 6,750-6,900 range, which generally dampens intraday volatility and suggests a tendency toward mean-reversion. Conversely, movement outside this band—specifically above 6,950 or below 6,730—could alter the gamma positioning and pave the way for more significant directional shifts.
Market Breadth and Internal Strength
The S&P 500 concluded the week with a modest 0.5% gain on Friday, reflecting small gains throughout the month, while the Nasdaq faced a 1.5% decline, primarily driven by weakness in large technology stocks. The S&P 500 remains above both its 50-day and 200-day moving averages, having reclaimed the 50-day line last week after an earlier dip, suggesting renewed market participation beyond just a few mega-cap stocks.
Sector performance varied notably, with technology facing headwinds throughout November—most notably from AI-linked companies—while sectors such as energy, consumer cyclicals, and certain areas of healthcare and financials saw positive movements towards month-end. Despite an earlier warning from indicators like the McClellan Oscillator suggesting internal weaknesses, the recent rebound has begun to improve breadth. However, concerns linger that this rally might be more fragile than typical broad-based advances, given its rotational and choppy nature.
Credit and Funding Landscape
The high-yield index (HYG) hovers around 81, near recent highs, indicating generally favorable credit conditions as it has progressively climbed through November. High-yield spreads are tightening relative to recent standards, reinforcing a “risk-on” attitude within credit markets. There are no apparent signs of acute funding stress; previous operational disruptions in futures markets were not indicative of systemic issues.
Currently, credit markets are not signaling alarms. As long as HYG remains above approximately 79, equity dips are more likely to be viewed as buying opportunities rather than triggers for widespread liquidation.
Sentiment and Investor Positioning
In the latest AAII survey, the bull-bear spread stands at around -11%, indicating a modest bearish sentiment, with bears outnumbering bulls by approximately 11 percentage points—below the historical mean of +6%. Conversely, the low equity put/call ratio suggests that traders are actively pursuing upside positions in individual equities.
In summary, while survey data points to cautious investor sentiment, options markets illustrate a preference for call buying and a diminishment of fear. This dichotomy often results in uneven uptrends with the potential for sudden pullbacks when complacency is inevitably challenged.
Global Risk Sentiment and Cross-Asset Overview
In the cryptocurrency sector, Bitcoin has stabilized around 90-91k following a significant correction earlier in the month, with modest recovery observed in the past week. This development underscores a risk-on atmosphere among investors.
Macro and data-calendar context
• The coming week (Dec 1–5) is busy but not as pivotal as the mid-December CPI/Payrolls
• Key events:
• Monday: ISM Manufacturing and construction spending.
• Tuesday: JOLTS job openings.
• Wednesday: ADP employment and ISM Services, plus several PMI and industrial-production figures.
• Thursday: Challenger job cuts, weekly jobless claims, and trade balance.
• Friday: Critically, the delayed PCE and core PCE inflation data for September, pushed back by the recent government shutdown.
• Fed communication: The Fed is effectively entering its pre-meeting quiet period; Powell’s upcoming speech is one of the last major remarks before the December meeting.
Macro narrative: Markets are leaning heavily toward another Fed rate cut in December and a benign inflation path.  Given that, negative surprises in PCE or labor data could trigger a sharp repricing.
The late-November rally appears to be a recalibration of positioning and sentiment following a mid-month scare within the tech sector, rather than a direct response to any significant data shock. This week's major macroeconomic event is Friday's PCE report; other data releases are expected to influence intraday fluctuations rather than alter the overarching trend.
Scenario Analysis and Probabilities
These scenarios represent probabilistic outcomes rather than certainties.
Primary Path — “Controlled Grind with Dip-Buying” (Approximately 50%)
As we enter Monday, expect a modest pullback from Friday's late gains, with overnight Globex trading projected to fluctuate between 6,820 and 6,880. Early in the week, the market may test support levels S1 (6,830–6,840) or potentially S2 (6,790–6,805), ultimately leading to renewed attempts to breach resistance at R1 and possibly R2. By the week’s end, prices are anticipated to oscillate within a broad range of 6,790–6,930 ahead of Friday's PCE announcement, with only temporary moves outside this zone.
Confirmation Criteria: This path will be validated if we observe rejections below the 6,780 level holding firm on a closing basis, accompanied by repeated failures of sellers to maintain downward pressure beneath S2.
Bear-Extension Path — “Deeper Reset Before Year-End” (Approximately 30%)
This scenario is triggered by a failed breakout above R1/R2 early in the week, coupled with a significant intraday reversal and a decisive 4-hour close beneath S2 and potentially S3. Initial price action may feature a spike into the 6,910–6,930 range followed by swift sell-offs, leading to a rapid retreat back through S1 and S2, particularly if the PCE data comes in above expectations or labor statistics surprise on the upside, prompting a re-assessment of potential Fed rate cuts.
Target Area: The initial aim would be the 6,650–6,700 region (near S4), with the possibility of a complete reversal down toward the more robust 6,620–6,650 band.
Confirmation Criteria: Continuous acceptance below approximately 6,730 on a 4-hour basis, combined with a daily close under the 6,780 threshold, would indicate a return to the narrative of a higher low for November.
Bull-Surprise Path — “Breakaway Into New Highs” (Approximately 20%)
This scenario is set in motion by a clear 4-hour and subsequent daily close above R2 and R3, driven by exceptionally benign PCE numbers and a supportive stance from the Federal Reserve. Initial price action should reflect minimal pullback in the early part of the week, steadily climbing past R1 and R2, ultimately resulting in a trend day that aggressively squeezes shorts above the 6,950 mark.
Target Area: The market will likely gravitate toward the extension zone of 7,050–7,100.
Confirmation Criteria: Sustained trading above 6,930 without significant reversals, robust market breadth, and a VIX that remains comfortably anchored in the mid-teens or lower will serve as key indicators for this bullish outlook.
Two A++ setups for the week
A++ Setup 1: Rejection short from R2
Fade spike into 6,910-6,930; Entries, SL, TPs
Entry zone: 6,890–6,900 on the first clean 1-minute pullback after the 5-minute lower high.
Initial stop: Above the rejection high plus a small buffer; planning number ~6,935. That is about 35-45 points of risk if filled near 6,895-6,900; refine to the actual 15-minute wick when it forms.
TP1: 6,830-6,840 (S1 / breakout base). From a 6,895 entry, that is roughly 55–65 points, giving at least 1.3-1.5R with the conservative stop and significantly more if the wick is tighter.
TP2: 6,790-6,805 (S2 demand pocket).
TP3 (runner): 6,730-6,750 (S3), only if tape is heavy (e.g., PCE or data shock).
A++ Setup 2: Continuation long from S2
ES Long (A++) - Buy reclaim of 6,790–6,805; Entries, SL, TPs
Entry zone: 6,805-6,815 on the first 1-minute higher-low after the 5-minute confirmation.
Initial stop: A few points below the spike low; planning number ~6,780, which gives about 25–35 points of risk.
TP1: 6,870-6,885 (R1 / prior week high band). From a 6,810 entry, that is roughly 60–75 points, delivering comfortably more than 2R with the planned stop.
TP2: 6,910-6,930 (R2 extension band).
TP3 (runner): 6,950-6,980 (R3 / upper weekly supply) if PCE and flows are supportive.
Good Luck !!!
If you want to contact me Email: info@algoindex.com or algoindex.com
免責聲明
這些資訊和出版物並非旨在提供,也不構成TradingView提供或認可的任何形式的財務、投資、交易或其他類型的建議或推薦。請閱讀使用條款以了解更多資訊。
If you want to contact me Email: info@algoindex.com or algoindex.com
免責聲明
這些資訊和出版物並非旨在提供,也不構成TradingView提供或認可的任何形式的財務、投資、交易或其他類型的建議或推薦。請閱讀使用條款以了解更多資訊。