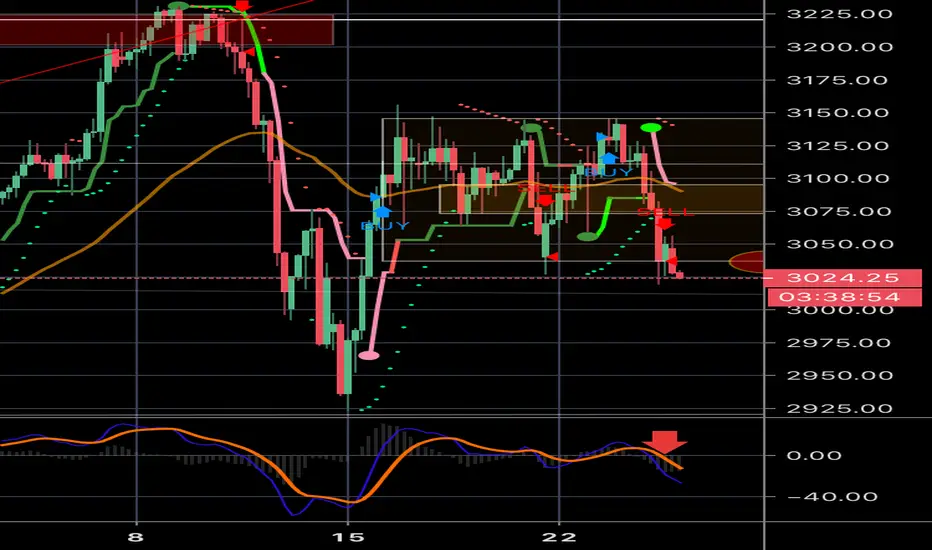
The 4H chart shows a 150 point consolidation and MACD points to deteriorating technical conditions, ripe for a breakdown soon. Perhaps a weak rebound to the 55EMA, which runs through the middle of the range like a resistance line, and then break out to the downside early next week.
See also the ES1! Daily chart for the imminent MACD crossover into bearish territory.
Clearly, 3230 was the top and a lower high formed at 3156. And breakdown out of this range puts more downside risk at play.
Watch out!
See also the ES1! Daily chart for the imminent MACD crossover into bearish territory.
Clearly, 3230 was the top and a lower high formed at 3156. And breakdown out of this range puts more downside risk at play.
Watch out!
免責聲明
這些資訊和出版物並不意味著也不構成TradingView提供或認可的金融、投資、交易或其他類型的意見或建議。請在使用條款閱讀更多資訊。