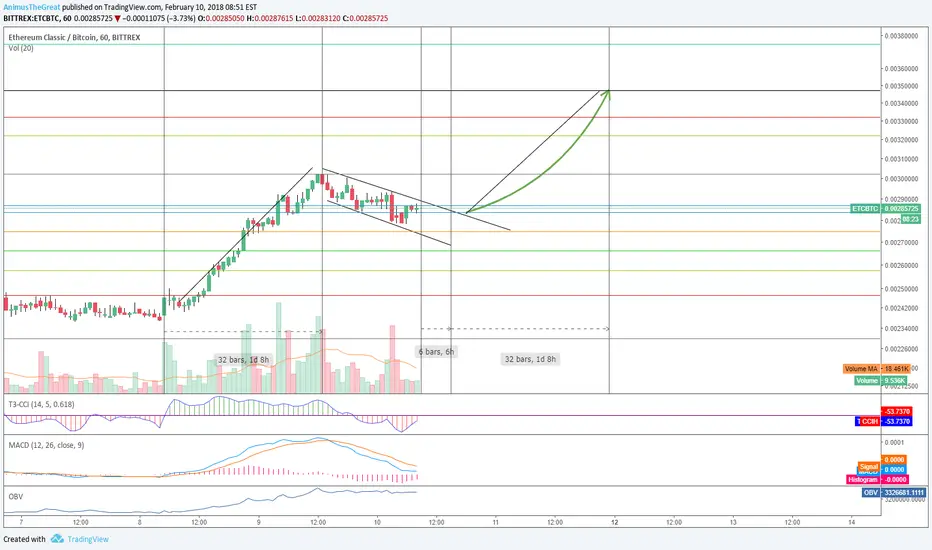
Recently I published idea on a daily timeframe for ETC with its timeline and what the dev team has up their sleeves for us till Novemeber. Airdrop/fork is coming up soon (around 24 days to go) which gives ETC still room to grow. After nice 27% gain ETC has been going into correction forming a nice bull flag on hourly chart. While TA indicators might not be the best possible on higher time frames (1h +) on hourly we can start to see positive signs which could indicate potential another leg up in next 6 - 7h if we brake the upper part of the flag and we get volume in.
TA indicators signs.
- CCI starting to turn upwards-. crossing the zero back to green could indicate breakout.
- MACD starting to close in and turning upwards
- OBV (On balance volume) --> staying on the straight line and not going downwards.
- Reverse Fib level on a bull run indicates strong support around 78.60% levels, which if we zoom out is the similar to the bull run fib levels which started on 8.2.2017.
I am adding to my position once breakout is identified and support verified due to the hefty road-map and usual FOMOS hitting in when forks happen.
Reason why I made green arrow just to 161.80% fibb level is because on 14.1.2018 this was also the highest peak of the run, and the length of the previous bull run usually mimics the length of the second bull run, however it has potential to go way higher. You can turn green arrow also as a quick daily trade if appropriate signals are there (Just idea and not financial advice).
Some of the other price levels to watch (sel signals of payed groups - leaked info):
- 0.00293
-0.00306
-0.00349
註釋
CCI- Almost at 0 MACD curving up with nice gap
Stoch RSI - Back into the channel and upwards
Hope to have close above the dotted line for confirmation
Bottom part of the flag at least 3 times verified (check)
Support at 50% level veriffied 3 times (check)
Volume (missing)... lets see..
It could go for a retest of support at 50%.
3h, 4h, charts also reacting for possible another leg up
交易進行
註釋
Looking at past posts on 10.2.Some of the other price levels to watch (sel signals of payed groups - leaked info):
- 0.00293 (Reached)
-0.00306 (reached)
-0.00349
交易結束:目標達成
Some of the other price levels to watch (sel signals of payed groups - leaked info): - 0.00293 (Reached)
-0.00306 (reached)
-0.00349 (reached)
My positions still continue. This were the short term targets for order I had with the short-term goal
免責聲明
這些資訊和出版物並不意味著也不構成TradingView提供或認可的金融、投資、交易或其他類型的意見或建議。請在使用條款閱讀更多資訊。
免責聲明
這些資訊和出版物並不意味著也不構成TradingView提供或認可的金融、投資、交易或其他類型的意見或建議。請在使用條款閱讀更多資訊。