ETH/USDT Weekly Chart Analysis.
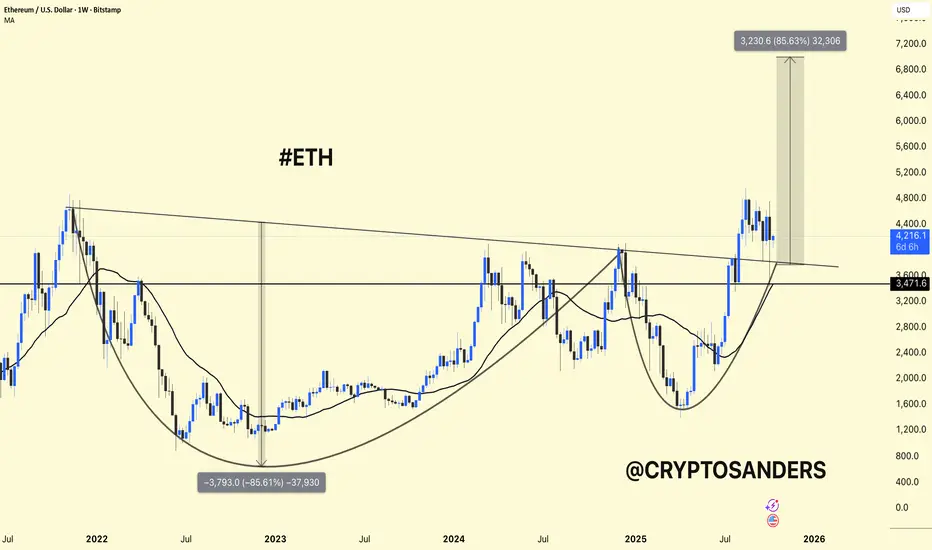
Structure: The chart shows a large cup-and-handle pattern – a classic bullish formation that signals a long-term trend reversal.
Current Price: Around $4,150, trading above the $3,470-$3,600 support area, which was the previous breakout area.
Moving Average (MA): ETH remains above the weekly MA (~$3,460) – confirming bullish momentum.
Breakout Area: The key downtrend line of 2022 has already been broken to the upside, showing strength.
Upside Target: If ETH maintains a price above $3,600, a potential upside move towards $7,000-$7,200 (≈ approximately +85%) is possible, as shown in the chart.
ETH is consolidating after its breakout, remaining stable above its support level.
Holding $3,600 → Bullish momentum likely to continue.
Loss of $3,400 → Could trigger a deeper decline towards $3,000.
DYOR | NFA
相關出版品
免責聲明
這些資訊和出版物並不意味著也不構成TradingView提供或認可的金融、投資、交易或其他類型的意見或建議。請在使用條款閱讀更多資訊。