📉 Ethereum (ETH/USD) – Weekly Timeframe Analysis
🕰️ Chart Pattern: Rising Wedge with Triple Top Formation
🔎 A deeper look at a high-probability bearish reversal pattern unfolding on the macro trend.
🔷 1. Market Context: Bullish Momentum Turning Bearish
Ethereum experienced a prolonged bullish trend starting from mid-2022, pushing steadily upward and forming higher highs and higher lows. This structure eventually evolved into a Rising Wedge—a well-known bearish reversal pattern that signals weakening bullish momentum as the range narrows.
Key Characteristics of the Wedge:
Both the support and resistance trendlines are rising, but the support line is steeper, indicating weakening buying pressure.
Price volatility shrinks, creating a squeeze that often results in a decisive breakout.
The breakout in this case occurred to the downside, confirming the wedge as a bearish structure.
🔺 2. Triple Top Pattern – Exhaustion at Resistance
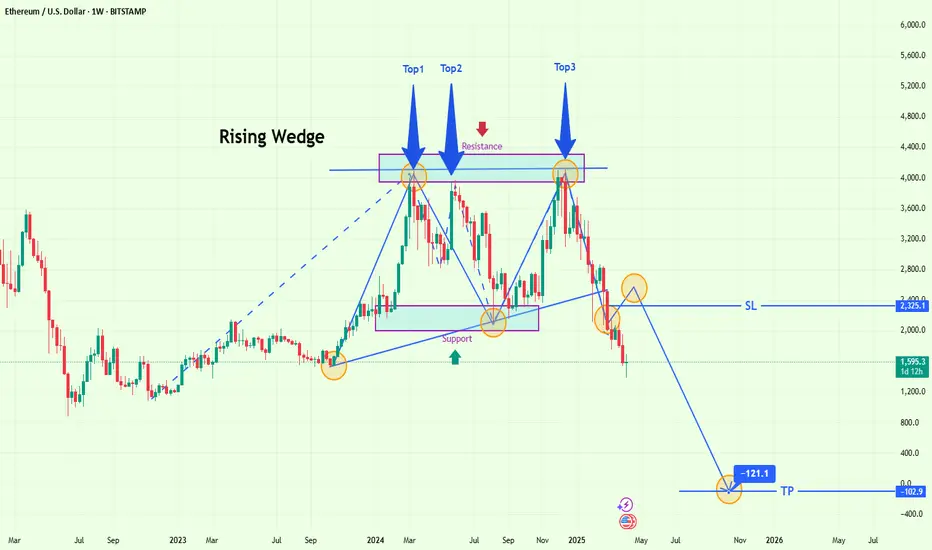
During the formation of the wedge, Ethereum attempted to break through a major horizontal resistance zone (~$4,000) three separate times, forming a Triple Top:
Top 1, Top 2, and Top 3 are clear and well-defined, each failing to close above the resistance level.
Triple Tops signify bullish exhaustion, often preceding major reversals.
This pattern inside the wedge adds a layer of confluence, boosting the strength and reliability of the bearish signal.
🧠 3. Market Psychology Behind the Setup
Buyers pushed ETH higher after each retracement, hoping for a breakout.
However, the failure to break above the resistance level three times shows that demand is drying up.
This forms a distribution zone where institutional traders often offload positions.
When the final push fails and support breaks, panic and selling pressure ensue — exactly what we see in this setup.
🔻 4. Breakdown Confirmation & Entry Opportunity
After forming the third top, Ethereum broke below the Rising Wedge’s support, triggering a confirmed bearish reversal.
A retest of the broken wedge support followed (classic retest behavior).
Price was rejected at the former support, now acting as resistance.
This provided a textbook short entry confirmation.
🧾 5. Trade Setup Details
Trade Element Description
Entry Zone After the retest rejection of broken wedge support
Stop Loss (SL) Above previous resistance zone at ~$2,325
Take Profit (TP) Long-term target around ~$102.9 (projected by wedge height)
Risk:Reward Favorable, potentially 1:5 or greater depending on entry timing
The projected target is aggressive, but justified using measured move theory from the height of the wedge applied to the breakdown point.
📏 6. Technical Confluences Supporting the Bearish Case
Bearish divergence (likely on RSI/MACD if added) near Top 2 and Top 3.
Volume decline during wedge formation, another wedge pattern validation.
Psychological resistance at $4,000 — round numbers often act as magnets or walls.
Macro environment and Bitcoin dominance could weigh on ETH's performance.
📌 7. Summary: Why This Setup Matters
The Rising Wedge with Triple Top combination is powerful, especially on a weekly timeframe.
The clear structural breakdown with retest confirms a trend shift from bullish to bearish.
Offers a clean short setup for swing traders and position traders with solid risk management.
The large projected drop is plausible given the macro range and breakdown mechanics.
This type of setup is rare and high-conviction — ideal for traders looking to capitalize on trend reversals and longer-term market shifts.
🕰️ Chart Pattern: Rising Wedge with Triple Top Formation
🔎 A deeper look at a high-probability bearish reversal pattern unfolding on the macro trend.
🔷 1. Market Context: Bullish Momentum Turning Bearish
Ethereum experienced a prolonged bullish trend starting from mid-2022, pushing steadily upward and forming higher highs and higher lows. This structure eventually evolved into a Rising Wedge—a well-known bearish reversal pattern that signals weakening bullish momentum as the range narrows.
Key Characteristics of the Wedge:
Both the support and resistance trendlines are rising, but the support line is steeper, indicating weakening buying pressure.
Price volatility shrinks, creating a squeeze that often results in a decisive breakout.
The breakout in this case occurred to the downside, confirming the wedge as a bearish structure.
🔺 2. Triple Top Pattern – Exhaustion at Resistance
During the formation of the wedge, Ethereum attempted to break through a major horizontal resistance zone (~$4,000) three separate times, forming a Triple Top:
Top 1, Top 2, and Top 3 are clear and well-defined, each failing to close above the resistance level.
Triple Tops signify bullish exhaustion, often preceding major reversals.
This pattern inside the wedge adds a layer of confluence, boosting the strength and reliability of the bearish signal.
🧠 3. Market Psychology Behind the Setup
Buyers pushed ETH higher after each retracement, hoping for a breakout.
However, the failure to break above the resistance level three times shows that demand is drying up.
This forms a distribution zone where institutional traders often offload positions.
When the final push fails and support breaks, panic and selling pressure ensue — exactly what we see in this setup.
🔻 4. Breakdown Confirmation & Entry Opportunity
After forming the third top, Ethereum broke below the Rising Wedge’s support, triggering a confirmed bearish reversal.
A retest of the broken wedge support followed (classic retest behavior).
Price was rejected at the former support, now acting as resistance.
This provided a textbook short entry confirmation.
🧾 5. Trade Setup Details
Trade Element Description
Entry Zone After the retest rejection of broken wedge support
Stop Loss (SL) Above previous resistance zone at ~$2,325
Take Profit (TP) Long-term target around ~$102.9 (projected by wedge height)
Risk:Reward Favorable, potentially 1:5 or greater depending on entry timing
The projected target is aggressive, but justified using measured move theory from the height of the wedge applied to the breakdown point.
📏 6. Technical Confluences Supporting the Bearish Case
Bearish divergence (likely on RSI/MACD if added) near Top 2 and Top 3.
Volume decline during wedge formation, another wedge pattern validation.
Psychological resistance at $4,000 — round numbers often act as magnets or walls.
Macro environment and Bitcoin dominance could weigh on ETH's performance.
📌 7. Summary: Why This Setup Matters
The Rising Wedge with Triple Top combination is powerful, especially on a weekly timeframe.
The clear structural breakdown with retest confirms a trend shift from bullish to bearish.
Offers a clean short setup for swing traders and position traders with solid risk management.
The large projected drop is plausible given the macro range and breakdown mechanics.
This type of setup is rare and high-conviction — ideal for traders looking to capitalize on trend reversals and longer-term market shifts.
免責聲明
這些資訊和出版物並不意味著也不構成TradingView提供或認可的金融、投資、交易或其他類型的意見或建議。請在使用條款閱讀更多資訊。