🔹 Chart Overview:
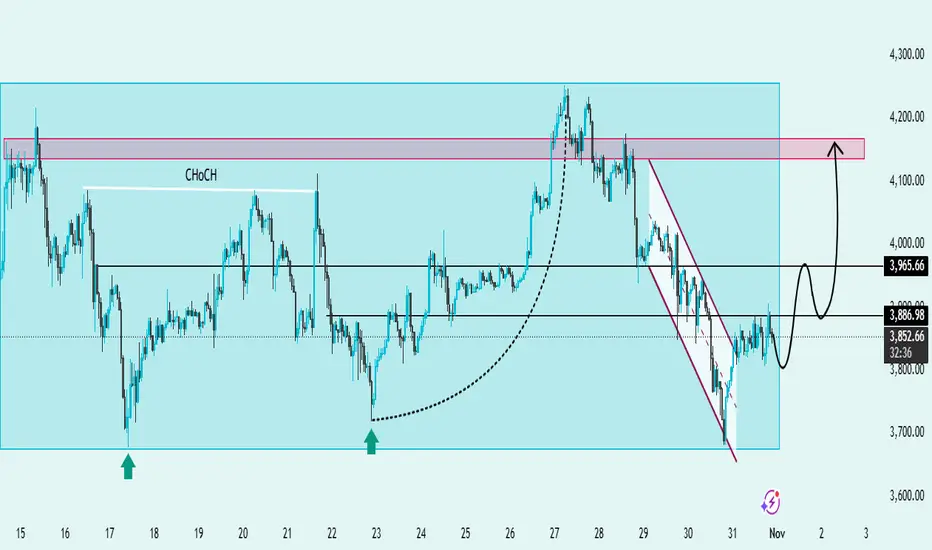
The chart illustrates a clear market structure shift (CHoCH) followed by a descending channel breakout, signaling a potential bullish reversal.
Price action has respected the major support zone around $3,700–$3,750 and is now showing signs of recovery.
💹 Key Levels:
Support Zone: $3,700 – $3,750 🛡️
Immediate Resistance: $3,965 ⚔️
Major Resistance Zone: $4,150 – $4,200 🧱
📈 Bullish Scenario (Main Bias):
ETH has broken out from the falling wedge pattern, a classic bullish reversal signal ✅.
If price sustains above $3,880–$3,900, we may see continuation toward the $3,965 short-term resistance and potentially a rally toward the $4,200 zone 🎯.
Confirmation Signs:
Retest of breakout trendline holds support 🟢
Higher highs and higher lows begin forming 🔄
⚠️ Bearish Scenario (Alternative View):
If ETH fails to hold above $3,850,
it may retest the $3,700 base again for liquidity before attempting a stronger rebound 📉.
🎯 Trading Outlook:
Bias: Bullish (reversal in progress)
Entry Zone: $3,850 – $3,880 (on confirmation)
Targets:
TP1: $3,965
TP2: $4,150 – $4,200
Invalidation: Break below $3,700 ❌
📌 Conclusion:
ETH/USD is showing a bullish recovery setup after breaking its descending channel.
Maintaining support above $3,850 could fuel a move toward $4,200, completing a clean market structure reversal 🌕💪
交易進行
JOIN MY TELEGRAM CHANNEL LINK 👇🏻
t.me/Classicallegendschool
t.me/Classicallegendschool
免責聲明
這些資訊和出版物並不意味著也不構成TradingView提供或認可的金融、投資、交易或其他類型的意見或建議。請在使用條款閱讀更多資訊。
JOIN MY TELEGRAM CHANNEL LINK 👇🏻
t.me/Classicallegendschool
t.me/Classicallegendschool
免責聲明
這些資訊和出版物並不意味著也不構成TradingView提供或認可的金融、投資、交易或其他類型的意見或建議。請在使用條款閱讀更多資訊。