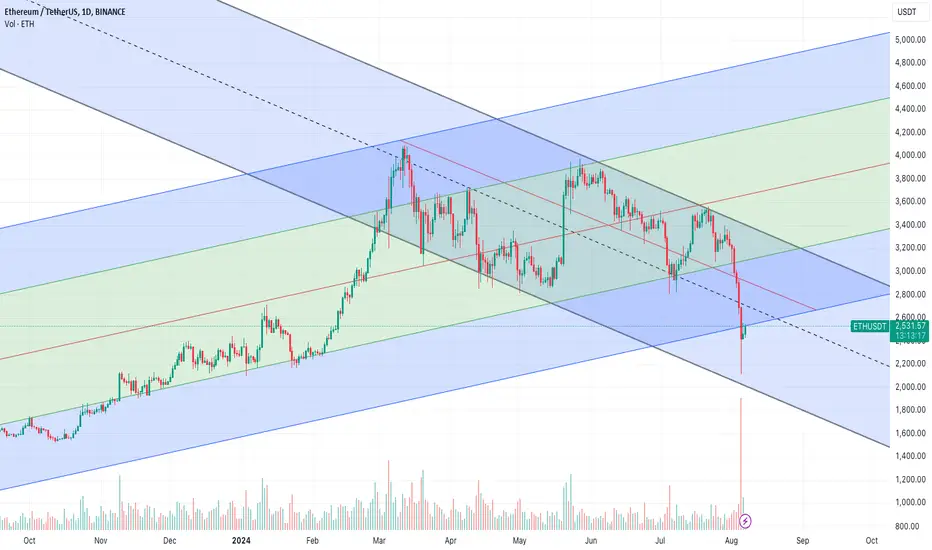
The recent candlestick with the large volume is a long red candle followed by a smaller green candle, which is a sign of potential short-term bottoming. However, this needs to be confirmed by further price action in the coming days.
The chart shows a significant spike in volume on the recent large red candle, which indicates a strong selling pressure. This suggests a potential capitulation or panic sell, followed by a slight recovery.
Decision Making:
For Holders: Given the higher probability of an upward movement, holding ETH might be a favorable decision, but the presence of a significant downward risk suggests that setting stop-loss orders or partial profit-taking strategies could help manage risk.
For Potential Buyers: The data suggests a favorable probability for entering a position, especially if you are prepared to handle potential short-term volatility.
免責聲明
這些資訊和出版物並不意味著也不構成TradingView提供或認可的金融、投資、交易或其他類型的意見或建議。請在使用條款閱讀更多資訊。
免責聲明
這些資訊和出版物並不意味著也不構成TradingView提供或認可的金融、投資、交易或其他類型的意見或建議。請在使用條款閱讀更多資訊。
