Technical Analysis of EURCAD
▪ Market Structure: Bullish Reversal in Progress
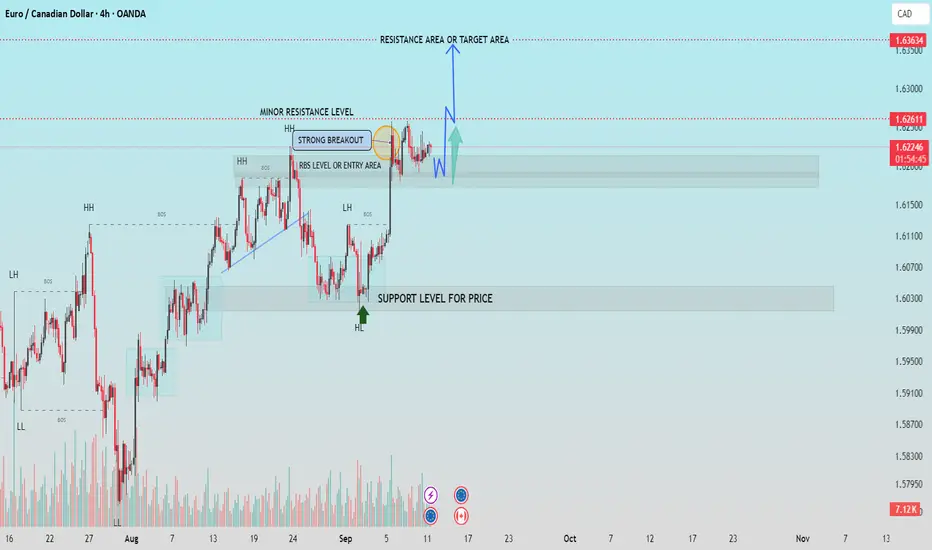
The pair previously formed a series of lower highs (LH) and lower lows (LL), indicating a downtrend.
A break of structure (BOS) followed by a higher low (HL) suggests a potential bullish reversal.
▪ Key Support & Resistance Zones
▫ Support Zone: 1.6000–1.6050
Price respected this level and formed a higher low (HL), confirming it as a strong demand zone.
▫Current Resistance Zone (RBS/Entry Area): 1.6200–1.6260
Price is currently retesting this area after a strong breakout.
▪ Breakout Confirmation
A strong breakout above the minor resistance level occurred with volume support.
Price has pulled back to retest the RBS (Resistance Becomes Support) zone, indicating a potential long entry opportunity.
▪Short-Term Projection
If the RBS zone holds, we can expect a bullish continuation toward the next resistance/target area at 1.6363.
If the zone fails, price may retest the support level near 1.6000 before another potential move higher.
▪ Conclusion
The current market structure and price action suggest a bullish bias. Traders should watch for bullish confirmation in the RBS zone for potential long setups targeting the 1.6363 level.
Support Me For More Insightful Analysis.
▪ Market Structure: Bullish Reversal in Progress
The pair previously formed a series of lower highs (LH) and lower lows (LL), indicating a downtrend.
A break of structure (BOS) followed by a higher low (HL) suggests a potential bullish reversal.
▪ Key Support & Resistance Zones
▫ Support Zone: 1.6000–1.6050
Price respected this level and formed a higher low (HL), confirming it as a strong demand zone.
▫Current Resistance Zone (RBS/Entry Area): 1.6200–1.6260
Price is currently retesting this area after a strong breakout.
▪ Breakout Confirmation
A strong breakout above the minor resistance level occurred with volume support.
Price has pulled back to retest the RBS (Resistance Becomes Support) zone, indicating a potential long entry opportunity.
▪Short-Term Projection
If the RBS zone holds, we can expect a bullish continuation toward the next resistance/target area at 1.6363.
If the zone fails, price may retest the support level near 1.6000 before another potential move higher.
▪ Conclusion
The current market structure and price action suggest a bullish bias. Traders should watch for bullish confirmation in the RBS zone for potential long setups targeting the 1.6363 level.
Support Me For More Insightful Analysis.
交易進行
交易結束:目標達成
💸FREE FOREX Signals in Telegram : t.me/FxInsightsHub0
🔹Join Our Telegram Channel, Pure Price Action Based Signals With Chart Analysis.
t.me/FxInsightsHub0
🚀FREE CRYPTO Signals In Telegram: t.me/FxInsightsHub0
🔹Join Our Telegram Channel, Pure Price Action Based Signals With Chart Analysis.
t.me/FxInsightsHub0
🚀FREE CRYPTO Signals In Telegram: t.me/FxInsightsHub0
相關出版品
免責聲明
這些資訊和出版物並不意味著也不構成TradingView提供或認可的金融、投資、交易或其他類型的意見或建議。請在使用條款閱讀更多資訊。