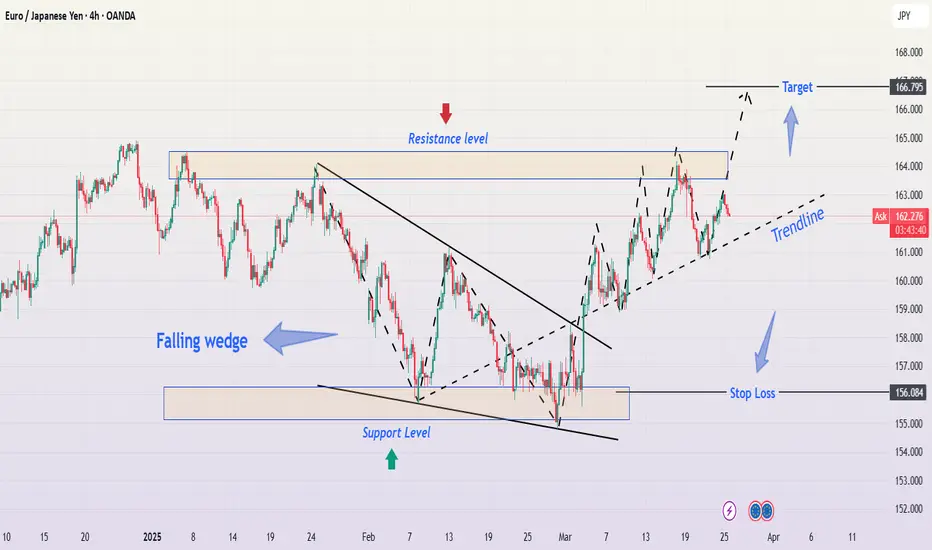
The EUR/JPY 4-hour chart is presenting a well-structured price action setup, featuring a falling wedge breakout, a strong bullish trendline, and key resistance and support levels. This detailed analysis will walk through each aspect of the chart to provide a professional trading perspective.
1. Market Context & Price Action Overview
At the beginning of the chart, EUR/JPY was experiencing a downtrend, characterized by a series of lower highs and lower lows, forming a falling wedge pattern. This pattern is typically a bullish reversal signal, indicating that sellers are losing strength and buyers may take control.
Once the price reached a key support zone near 156.08, it bounced, leading to a breakout of the falling wedge. Since the breakout, the price has been moving in a bullish trend, forming higher highs and higher lows, respecting an ascending trendline.
2. Technical Patterns & Key Levels
🔹 Falling Wedge Pattern – Bullish Breakout
The falling wedge is identified by two converging trendlines sloping downward.
It indicates that bearish momentum is weakening as price compresses.
A breakout above the upper wedge line confirmed the shift in trend direction.
The breakout candle had strong bullish momentum, suggesting increased buyer interest.
🔹 Support and Resistance Levels
📉 Major Support Level (~156.08):
This level acted as a demand zone, where buyers aggressively stepped in.
The price formed multiple rejections at this level before breaking upwards.
A stop-loss placement below this level is ideal for bullish trades.
📈 Resistance Level (~163.50 - 164.00):
This zone has been tested multiple times as price approaches from below.
A break and retest of this resistance would confirm further bullish momentum.
If price faces strong rejection, a short-term pullback to the trendline may occur.
🎯 Final Target (~166.79):
This is the next major resistance level, aligning with previous swing highs.
It serves as a strong take-profit (TP) level for long positions.
If price reaches this level, we may see a consolidation phase or possible reversal.
3. Trend Analysis & Market Structure
📈 Bullish Trendline:
The price has been respecting an ascending trendline, acting as dynamic support.
This trendline connects higher lows, confirming a strong bullish trend.
As long as price stays above this line, buyers remain in control.
📊 Market Structure:
Since breaking out from the falling wedge, the price is forming a classic bullish structure of higher highs and higher lows.
This indicates sustained buyer pressure and a potential continuation toward resistance levels.
4. Trading Setup & Risk Management
📌 Entry Strategy:
Aggressive Entry: After the wedge breakout with a tight stop-loss.
Conservative Entry: Wait for a pullback to the trendline support or a break and retest of resistance at 163.50 - 164.00.
🔻 Stop Loss Placement:
Below 156.08 (previous support zone) to protect against trend invalidation.
Alternatively, below the rising trendline for a dynamic SL approach.
🎯 Take Profit Targets:
TP1: 163.50 - 164.00 resistance zone (Partial profits).
TP2: 166.79 final target, aligning with historical resistance.
5. Market Outlook & Potential Scenarios
✅ Bullish Scenario (High Probability)
If price holds above the trendline and breaks 163.50 - 164.00, we expect a continuation towards 166.79.
The structure remains intact as long as higher highs and higher lows persist.
❌ Bearish Scenario (Low Probability, but Possible)
If price fails at resistance and breaks below the trendline, it could signal a deeper retracement.
A break below 156.08 would completely invalidate the bullish setup, leading to a potential downtrend.
6. Summary & Key Takeaways
Trend Bias: Bullish, supported by a falling wedge breakout and higher highs.
Key Levels: Support at 156.08, resistance at 163.50 - 164.00, final target at 166.79.
Trading Strategy: Buy on retests of trendline or resistance breakouts.
Risk Management: Use dynamic stop-loss levels to minimize downside exposure.
🔹 Final Verdict:
If price remains above support and successfully breaks 163.50 - 164.00, a strong move toward 166.79 is expected. However, traders should remain cautious of trendline breakdowns and manage risk accordingly.
📊 Stay disciplined, follow your trading plan, and always use stop-loss protection! 🚀 #EURJPY #Forex #TradingStrategy #PriceAction
免責聲明
這些資訊和出版物並不意味著也不構成TradingView提供或認可的金融、投資、交易或其他類型的意見或建議。請在使用條款閱讀更多資訊。