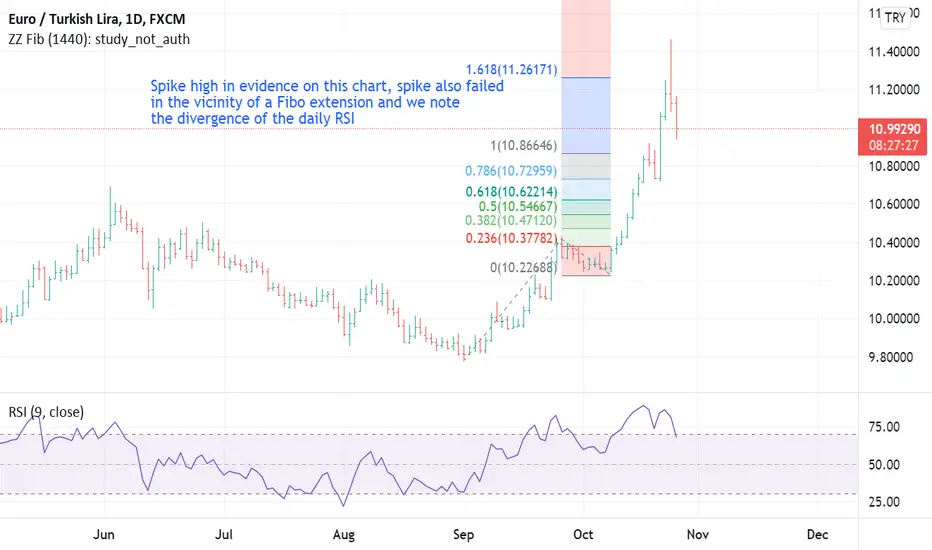
There are a couple of technical analysis patterns that can help identify reversals – some are more important than others, but this morning we note this beauty: - The spike high on daily EUR/TRY chart
The spike high on EUR/TRY, not only did it chart a spike high, but it reversed from a Fibonacci extension (1.618) AND we note the divergence of the daily RSI. All these factors imply that the market has topped.
Spike highs are identified by the following criteria:
• a High sharply above the days on either side,
• a Close near the day's Low, and
• a strong preceding rally.
The more extreme each of these conditions are, the greater the likelihood of a reversal.
NB RSI = Relative strength Index (click here if you would like to know more - investopedia.com/terms/r/rsi.asp).
Fibonacci extensions: Click here if you would like to know more: - investopedia.com/terms/f/fibonacciextensions.asp
Disclaimer:
The information posted on Trading View is for informative purposes and is not intended to constitute advice in any form, including but not limited to investment, accounting, tax, legal or regulatory advice. The information therefore has no regard to the specific investment objectives, financial situation or particular needs of any specific recipient. Opinions expressed are our current opinions as of the date appearing on Trading View only. All illustrations, forecasts or hypothetical data are for illustrative purposes only. The Society of Technical Analysts Ltd does not make representation that the information provided is appropriate for use in all jurisdictions or by all Investors or other potential Investors. Parties are therefore responsible for compliance with applicable local laws and regulations. The Society of Technical Analysts will not be held liable for any loss or damage resulting directly or indirectly from the use of any information on this site.
The STA is the oldest technical analysis organisation in the world and to celebrate that fact, we have a free downloadable book on technical analysis here -
technicalanalysts.com
technicalanalysts.com
免責聲明
這些資訊和出版物並不意味著也不構成TradingView提供或認可的金融、投資、交易或其他類型的意見或建議。請在使用條款閱讀更多資訊。
The STA is the oldest technical analysis organisation in the world and to celebrate that fact, we have a free downloadable book on technical analysis here -
technicalanalysts.com
technicalanalysts.com
免責聲明
這些資訊和出版物並不意味著也不構成TradingView提供或認可的金融、投資、交易或其他類型的意見或建議。請在使用條款閱讀更多資訊。