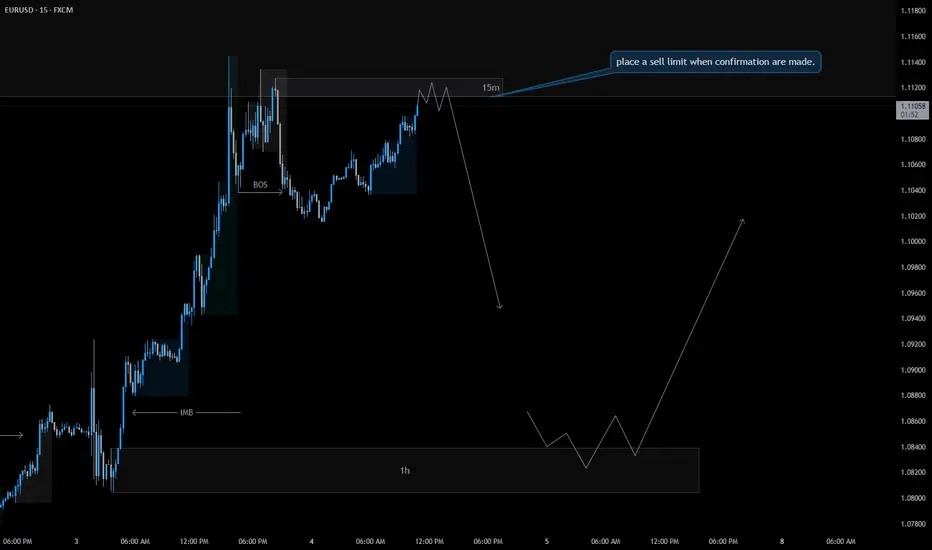
This chart outlines a potential sell trade setup based on price action and Smart Money Concepts (SMC). Let's break it down step by step:
---
1. Market Structure & Key Zones
- Break of Structure (BOS)
- This signifies that the price has recently shifted in market structure.
- The last BOS suggests that buyers are losing strength, indicating a potential reversal.
- Imbalance (IMB)
- The imbalance is an area where price moved too quickly, leaving inefficiencies.
- Institutions often push price back to these levels before a continuation in the opposite direction.
- Key Resistance (Sell Limit Zone)
- This is marked near a previous double-top formation, indicating liquidity buildup.
- Traders will wait for confirmation (rejection or bearish engulfing) before entering a short position.
---
2. Trade Execution Plan
- Entry Strategy
- Place a Sell Limit Order at the marked resistance level after confirmation (e.g., rejection wicks or bearish candle close).
- If price fails to confirm, avoid entering the trade.
- Target (Take Profit - TP)
- First TP: Short-term support level.
- Final TP: The 1H demand zone, where price is expected to reverse after completing the short move.
- Stop Loss (SL) Placement
- Above the liquidity grab (stop hunt zone) to avoid premature stop-outs.
- Ensure a good risk-to-reward ratio (RRR), ideally 1:3 or more.
---
3. Expected Price Movement
- First Move (Short Entry)
- Price is expected to reject the 15m resistance, confirming bearish momentum.
- A strong move down towards the 1-hour demand zone is anticipated.
- Potential Reversal (Bullish Setup in 1H Zone)
- Once price hits the 1H demand, it could start a bullish reversal.
- The price may form higher lows, leading to a long setup in the future.
---
### 4. Additional Confirmation Indicators
- DXY (US Dollar Index)
- If DXY is bullish, it strengthens the bearish case for EUR/USD.
- Volume Analysis
- Watch for decreasing buying volume at resistance.
- Lower Timeframe Confirmation (5m / 1m)
- Look for market structure shifts (lower highs and lower lows) before executing a short position.
---
1. Market Structure & Key Zones
- Break of Structure (BOS)
- This signifies that the price has recently shifted in market structure.
- The last BOS suggests that buyers are losing strength, indicating a potential reversal.
- Imbalance (IMB)
- The imbalance is an area where price moved too quickly, leaving inefficiencies.
- Institutions often push price back to these levels before a continuation in the opposite direction.
- Key Resistance (Sell Limit Zone)
- This is marked near a previous double-top formation, indicating liquidity buildup.
- Traders will wait for confirmation (rejection or bearish engulfing) before entering a short position.
---
2. Trade Execution Plan
- Entry Strategy
- Place a Sell Limit Order at the marked resistance level after confirmation (e.g., rejection wicks or bearish candle close).
- If price fails to confirm, avoid entering the trade.
- Target (Take Profit - TP)
- First TP: Short-term support level.
- Final TP: The 1H demand zone, where price is expected to reverse after completing the short move.
- Stop Loss (SL) Placement
- Above the liquidity grab (stop hunt zone) to avoid premature stop-outs.
- Ensure a good risk-to-reward ratio (RRR), ideally 1:3 or more.
---
3. Expected Price Movement
- First Move (Short Entry)
- Price is expected to reject the 15m resistance, confirming bearish momentum.
- A strong move down towards the 1-hour demand zone is anticipated.
- Potential Reversal (Bullish Setup in 1H Zone)
- Once price hits the 1H demand, it could start a bullish reversal.
- The price may form higher lows, leading to a long setup in the future.
---
### 4. Additional Confirmation Indicators
- DXY (US Dollar Index)
- If DXY is bullish, it strengthens the bearish case for EUR/USD.
- Volume Analysis
- Watch for decreasing buying volume at resistance.
- Lower Timeframe Confirmation (5m / 1m)
- Look for market structure shifts (lower highs and lower lows) before executing a short position.
免責聲明
這些資訊和出版物並不意味著也不構成TradingView提供或認可的金融、投資、交易或其他類型的意見或建議。請在使用條款閱讀更多資訊。
免責聲明
這些資訊和出版物並不意味著也不構成TradingView提供或認可的金融、投資、交易或其他類型的意見或建議。請在使用條款閱讀更多資訊。
