Dear traders, as a continuation of my previous idea, I am adding further relevant points
and updating the EUR/USD idea in view of the current developments in the market and also
adding a possible trade signal.
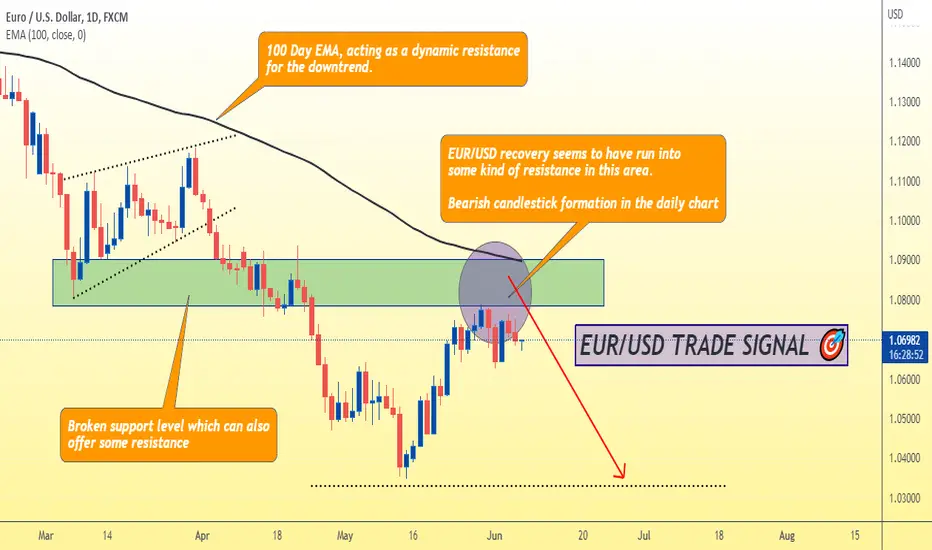
In the daily chart, you can see that bearish candlesticks have formed in the resistance level.
This is a strong indicator that price may drop further in the coming days.
If EUR/USD is unable to break the resistance level that I have highlighted with a circle in my chart,
I would advise traders to short EURUSD@1.07-1.0760 with SL above 1.08 and TP at 1.04
and updating the EUR/USD idea in view of the current developments in the market and also
adding a possible trade signal.
In the daily chart, you can see that bearish candlesticks have formed in the resistance level.
This is a strong indicator that price may drop further in the coming days.
If EUR/USD is unable to break the resistance level that I have highlighted with a circle in my chart,
I would advise traders to short EURUSD@1.07-1.0760 with SL above 1.08 and TP at 1.04
免責聲明
這些資訊和出版物並不意味著也不構成TradingView提供或認可的金融、投資、交易或其他類型的意見或建議。請在使用條款閱讀更多資訊。
免責聲明
這些資訊和出版物並不意味著也不構成TradingView提供或認可的金融、投資、交易或其他類型的意見或建議。請在使用條款閱讀更多資訊。