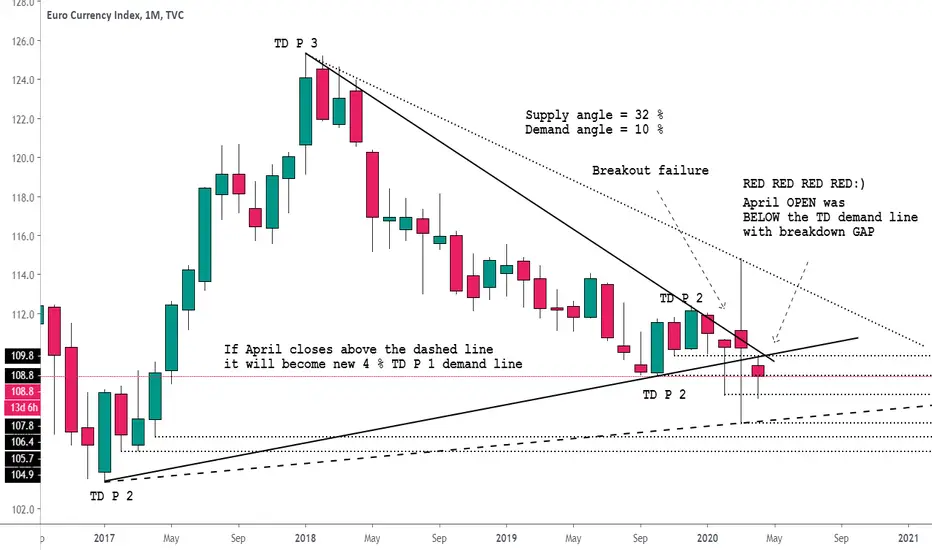
Euro index chart. Monthly. Price is driven by global supply and demand. And what we are observing, is a clear oversupply of euro (all selling) and weakening demand (less international interest in euro) on universal scale. Buyers failed to break the supply line and April opened below the demand line with a gap.
Top Absolute Correlation
1 EURUSD - USDX -96.8%
2 EURUSD - USDPLN -95.8%
3 EURUSD - USDCZK -92.7%
4 EURUSD - EURSGD 88.9%
5 EURUSD - EURCHF 86.7%
6 EURUSD - USDSGD -81.6%
7 EURUSD - USDHUF -79.9%
8 EURUSD - EURJPY 78.7%
9 EURUSD - EURCAD 74.7%
10 EURUSD - HK50 70.5%
Top Absolute Correlation
1 EURUSD - USDX -96.8%
2 EURUSD - USDPLN -95.8%
3 EURUSD - USDCZK -92.7%
4 EURUSD - EURSGD 88.9%
5 EURUSD - EURCHF 86.7%
6 EURUSD - USDSGD -81.6%
7 EURUSD - USDHUF -79.9%
8 EURUSD - EURJPY 78.7%
9 EURUSD - EURCAD 74.7%
10 EURUSD - HK50 70.5%
免責聲明
這些資訊和出版物並不意味著也不構成TradingView提供或認可的金融、投資、交易或其他類型的意見或建議。請在使用條款閱讀更多資訊。