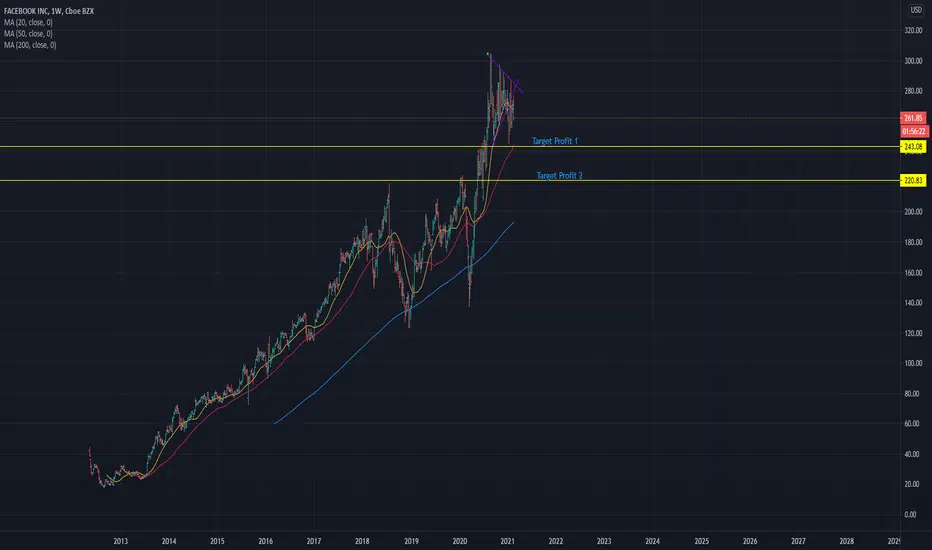
This is a Daily chart of Facebook Inc.
A couple of chart patterns to observe here:
1. It has broken down from a symmetrical triangle, retraced, and now heading down.
2. It is also an inverted cup & handle pattern.
Although it has still in an uptrend, I will prefer to exit any exiting trade and wait for it to head down lower to target profit 1 and/ or target profit 2 before re-entering.
Target profit 1 is support + a 50 moving average level on the Weekly chart.
Target profit 2 is support + a 200 moving average level on the Weekly chart (it should move up to that level with time or near it).
If you're a short term trader, you will have to find a better entry timing as putting a stop loss will prove a challenge unless you are willing to accept lower risk-to-reward.
If you have any symbols that you would like me to analyze, feel free to leave a comment!
*My apologies! I forgot to switch it back to the Daily chart. I don't know how to change it back as I'm still new to using Trading View.
註釋
(Disclaimer: not giving any trading & investment advise. Just sharing views)註釋
Would like to see today ends up a doji and head down tomorrow.If it doesn't, then the setup might be invalidated.
註釋
no doji but setup still valid.Looking forward to hitting profit targets!
註釋
NASDAQ turns bullish today.Chances are the smart money is buying again!
註釋
Been trading side ways for 2 weeks. Setup still intact for now註釋
If price peaks above $267 then this setup is considered invalidated交易結束:達到停損點
Did peak above $267.Although it still look bearish but it is what it is.
免責聲明
這些資訊和出版物並不意味著也不構成TradingView提供或認可的金融、投資、交易或其他類型的意見或建議。請在使用條款閱讀更多資訊。
免責聲明
這些資訊和出版物並不意味著也不構成TradingView提供或認可的金融、投資、交易或其他類型的意見或建議。請在使用條款閱讀更多資訊。