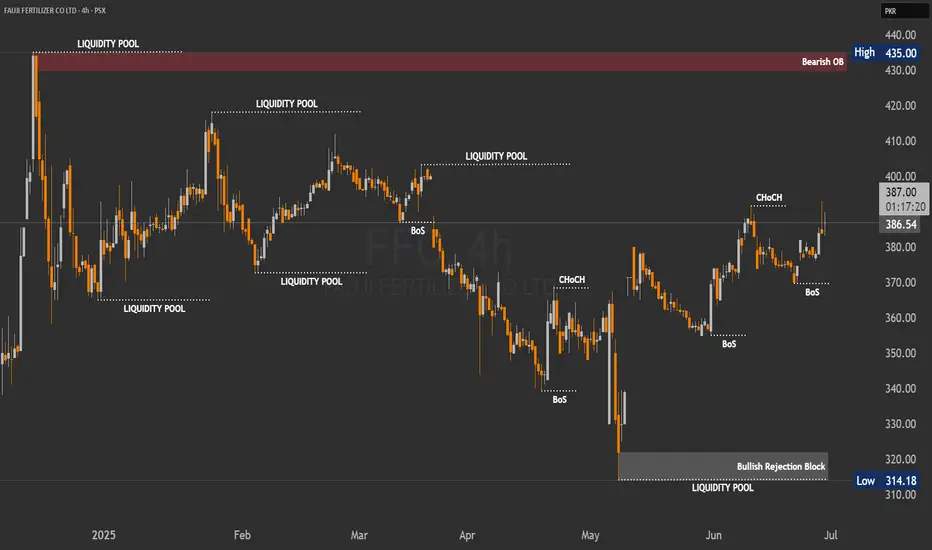
By analyzing the FFC chart on the 4-hour timeframe, we can see that price initially followed our bullish scenario, climbing 23 rupees up to 393. However, after hitting that level, price reversed and currently trading around 389 and eventually finding support around 376.
This area acted as a strong demand zone. Currently, FFC is trading around 389, and as long as price holds above the marked demand zone, we may expect another bullish move towards 390 and 400.
This area acted as a strong demand zone. Currently, FFC is trading around 389, and as long as price holds above the marked demand zone, we may expect another bullish move towards 390 and 400.
交易進行
FFC now up to 390.00交易結束:目標達成
FFC 404 🚀🚀免責聲明
這些資訊和出版物並不意味著也不構成TradingView提供或認可的金融、投資、交易或其他類型的意見或建議。請在使用條款閱讀更多資訊。
免責聲明
這些資訊和出版物並不意味著也不構成TradingView提供或認可的金融、投資、交易或其他類型的意見或建議。請在使用條款閱讀更多資訊。