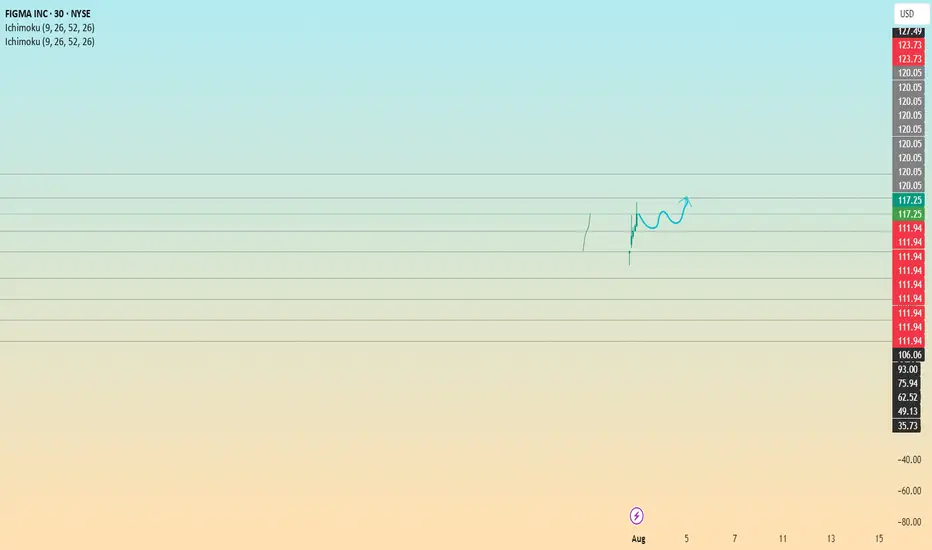
📈 FIGMA INC – Bullish Continuation Setup (30m Timeframe)
Current Price: $117.25
Previous Close: $109.59
Intraday Move: +6.99%
---
🔍 Technical Breakdown:
Massive Bullish Surge: FIGMA recently witnessed a strong breakout with a long bullish candle, indicating aggressive buying and possible news or earnings catalyst.
Support Zone: The initial rejection and recovery near the $108.60 level suggest this as a potential short-term support. Price did not break lower, forming a strong base.
Bullish Flag / Continuation Pattern: The current consolidation after the spike resembles a bullish flag or a rounded pullback, typically a continuation signal.
Ichimoku Cloud: Active on the chart, though not fully visible — Ichimoku trend settings (9, 26, 52) suggest momentum is strong. Price is likely trading above the cloud, a bullish sign.
---
📊 Forecast & Price Projection:
If the price sustains above the $115.50–$117.00 zone:
Immediate Resistance: $124.60
Breakout Target (measured move): $132–135 range
Mid-term Target: $145–150 if momentum continues and volume confirms
---
📌 Bias: Bullish
---
🧠 Commentary:
This setup is a textbook example of momentum continuation following a volume-backed breakout. The consolidation is healthy and suggests buyers are preparing for the next leg up. Patience is key; a breakout above $124 may offer the next confirmation.
---
🔔 Trade Idea (Not Financial Advice):
Entry: Break above $124.60
Stop Loss: Below $115.00
Target 1: $132
Target 2: $145
免責聲明
這些資訊和出版物並不意味著也不構成TradingView提供或認可的金融、投資、交易或其他類型的意見或建議。請在使用條款閱讀更多資訊。
免責聲明
這些資訊和出版物並不意味著也不構成TradingView提供或認可的金融、投資、交易或其他類型的意見或建議。請在使用條款閱讀更多資訊。
