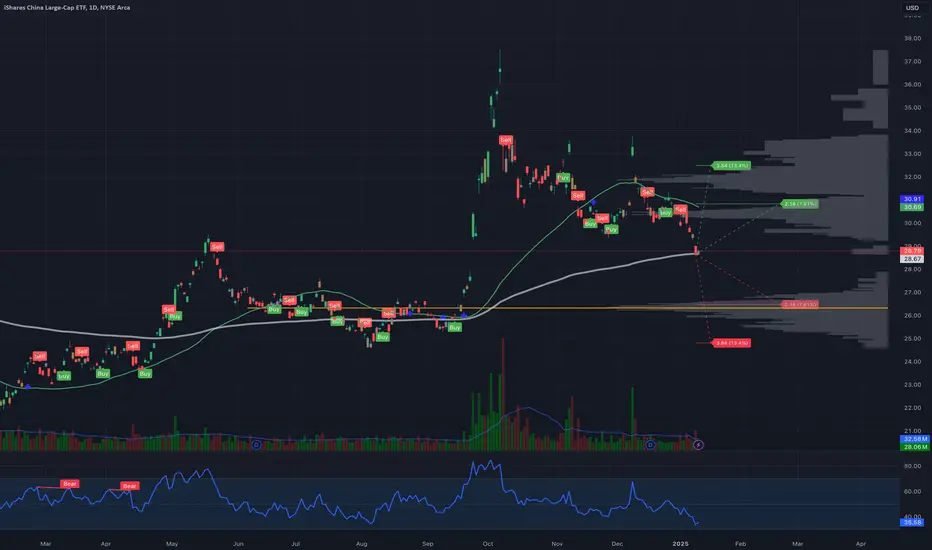
FXI Technical Analysis: Testing Key Support Before Potential Upward Move on Policy Developments
Description:
In this analysis, we examine FXI (FTSE China 50 Index ETF) and its recent volatility trends between January 17 and February 21, 2025. FXI has seen a significant drop in implied volatility from 117.10% to 37.82%, accompanied by a drastic reduction in open interest from 123,059 to 5,247. This indicates a potential decrease in market uncertainty regarding the Chinese market.
Key Points:
Implied Volatility: Decreased from 117.10% to 37.82%
Open Interest: Decreased from 123,059 to 5,247
Near-term Volatility: 3.10 (>1 abnormal)
Analysis: FXI is likely to test the lower support level around January 17, which also aligns with a critical resistance area. Following this, based on upcoming policy decisions related to Trump’s inauguration and U.S.-China relations, FXI may either move upwards or consolidate sideways. My assessment leans towards a greater potential for an upward movement, driven by positive policy developments.
Trading Strategy:
Support Test: Monitor FXI as it approaches the key support level for potential entry points.
Upward Bias: Look for bullish signals post-support test to capitalize on the anticipated upward move.
Risk Management: Implement stop-loss orders to protect against unexpected downward movements.
Join the Discussion: What are your thoughts on FXI’s potential move? Do you agree with the upward bias based on policy developments? Share your insights in the comments below!
免責聲明
這些資訊和出版物並不意味著也不構成TradingView提供或認可的金融、投資、交易或其他類型的意見或建議。請在使用條款閱讀更多資訊。
免責聲明
這些資訊和出版物並不意味著也不構成TradingView提供或認可的金融、投資、交易或其他類型的意見或建議。請在使用條款閱讀更多資訊。
