The GBP/JPY pair has gained over 0.5% today in favor of the British pound, as the Japanese yen continues to weaken steadily. The recent escalation in the trade war, where potential 25% tariffs may begin to affect Japan in the short term, has contributed to the yen’s steady decline. For now, this remains one of the main catalysts behind the price movement, which is trending lower in the near term. As uncertainty surrounding the yen persists, buying pressure on GBP/JPY could become more significant.
Broad Sideways Range at Risk
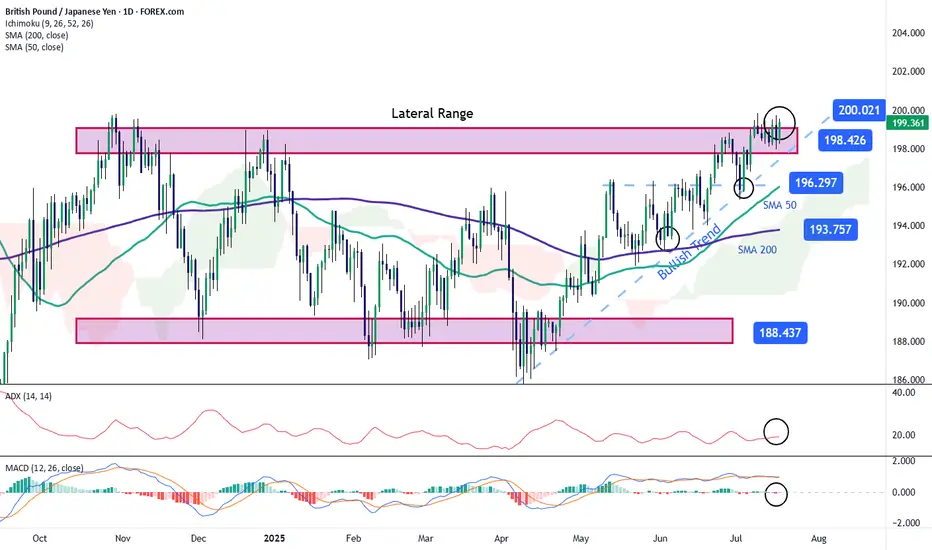
Recent short-term bullish movements are beginning to test the upper boundary at 198.42, a key level within the broad sideways range that has dominated the chart in recent months. For now, the price could face a period of persistent neutrality as it tries to push through this upper barrier, which remains the most relevant resistance zone. If buying pressure holds steady over the coming sessions, the range could come under threat, potentially giving way to a more dominant and consistent bullish trend in the short term.
ADX
The ADX line is currently oscillating close to the 20 level, which typically indicates low average volatility over the past 14 sessions. This could be signaling a period of price consolidation, especially as the pair approaches current resistance zones.
MACD
The MACD histogram remains close to the zero line, suggesting a lack of clear direction in the short-term momentum of the moving averages. As long as this persists, it will likely reinforce the current neutral sentiment around resistance levels.
Key Levels:
Written by Julian Pineda, CFA – Market Analyst
Broad Sideways Range at Risk
Recent short-term bullish movements are beginning to test the upper boundary at 198.42, a key level within the broad sideways range that has dominated the chart in recent months. For now, the price could face a period of persistent neutrality as it tries to push through this upper barrier, which remains the most relevant resistance zone. If buying pressure holds steady over the coming sessions, the range could come under threat, potentially giving way to a more dominant and consistent bullish trend in the short term.
ADX
The ADX line is currently oscillating close to the 20 level, which typically indicates low average volatility over the past 14 sessions. This could be signaling a period of price consolidation, especially as the pair approaches current resistance zones.
MACD
The MACD histogram remains close to the zero line, suggesting a lack of clear direction in the short-term momentum of the moving averages. As long as this persists, it will likely reinforce the current neutral sentiment around resistance levels.
Key Levels:
- 200.00 – Tentative resistance zone, corresponding to the next psychological level to watch in the short term. Sustained price action above this level could confirm a breakout of the broad channel, paving the way for a dominant bullish trend.
- 198.42 – Nearby barrier, marking the upper boundary of the broad range. Sustained moves above this level could further reinforce the prevailing bullish bias.
- 196.297 – Key support level, marking the recent low. If selling pressure brings the price back to this area, the market could resume the broad sideways range seen in previous sessions.
Written by Julian Pineda, CFA – Market Analyst
免責聲明
這些資訊和出版物並不意味著也不構成TradingView提供或認可的金融、投資、交易或其他類型的意見或建議。請在使用條款閱讀更多資訊。