Hello traders, with CPI data coming out in less than 4 hours, let us take a look at the
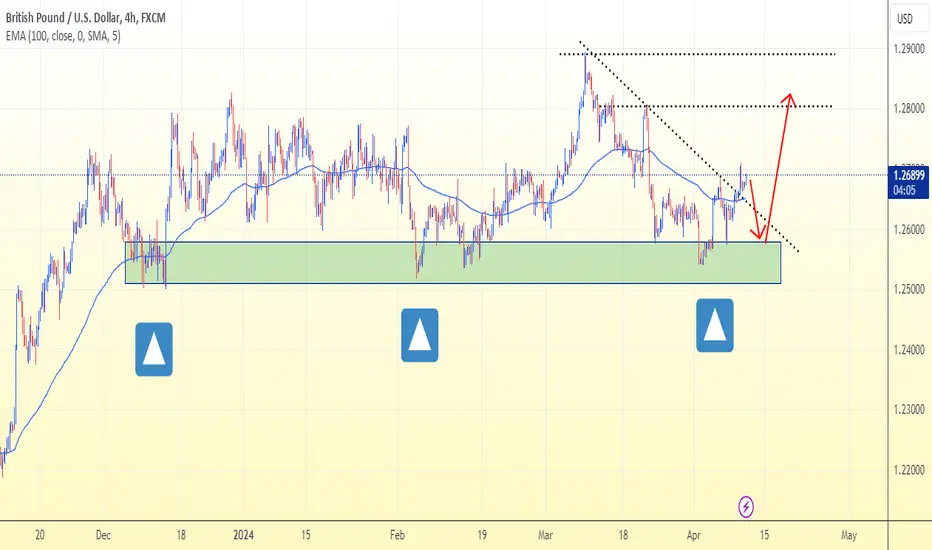
4H chart of GBP/USD.
The situation on the 4H chart is definitely bullish as price has bounced off the 1.2540
support level and currently it is consolidating above the 100 period moving average.
However, spikes or dips during CPI can not be ruled out.
So, is there is a dip to the support zone or at least 1.26 level, I would consider buying
GBP/USD. Similarly, if it spikes up to 1.28 and fails to break 1.28, I would consider selling.
Either way, I would trade after the data is released.
註釋
Price dips as I indicated in the chart交易進行
Bought@1.2565 as per plan註釋
Currently the buy is running in loss. However, I have added another buy@1.2538免責聲明
這些資訊和出版物並不意味著也不構成TradingView提供或認可的金融、投資、交易或其他類型的意見或建議。請在使用條款閱讀更多資訊。
免責聲明
這些資訊和出版物並不意味著也不構成TradingView提供或認可的金融、投資、交易或其他類型的意見或建議。請在使用條款閱讀更多資訊。