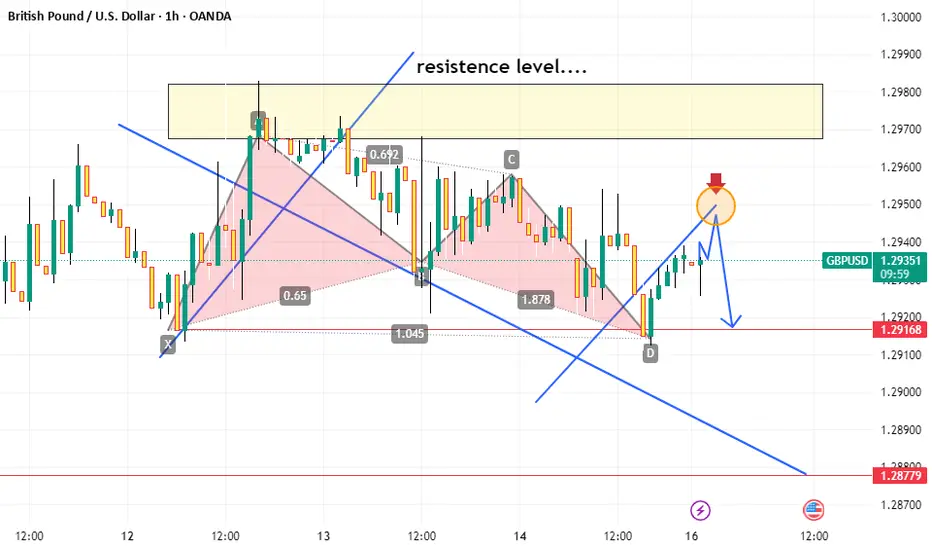
This chart is a technical analysis of the GBP/USD currency pair on the 1-hour timeframe. Here’s what it indicates:
Resistance Level (Yellow Box): The price has reached a resistance zone where sellers may enter the market.
Harmonic Pattern: The shaded pink pattern appears to represent a harmonic trading pattern, possibly a Gartley or Bat pattern, suggesting a reversal at certain Fibonacci levels.
Trendlines (Blue Lines): There are two diagonal trendlines, indicating possible price movements.
Potential Reversal (Red Arrow & Circle): The price is approaching a key level (highlighted by the orange circle and red arrow), suggesting a potential bearish reversal.
Projected Movement (Blue Arrows): The forecast suggests a possible minor upward move before price drops towards the support level at 1.29168 and possibly 1.28779.
Overall, the chart suggests that GBP/USD may face selling pressure near resistance and could decline.
免責聲明
這些資訊和出版物並不意味著也不構成TradingView提供或認可的金融、投資、交易或其他類型的意見或建議。請在使用條款閱讀更多資訊。
免責聲明
這些資訊和出版物並不意味著也不構成TradingView提供或認可的金融、投資、交易或其他類型的意見或建議。請在使用條款閱讀更多資訊。