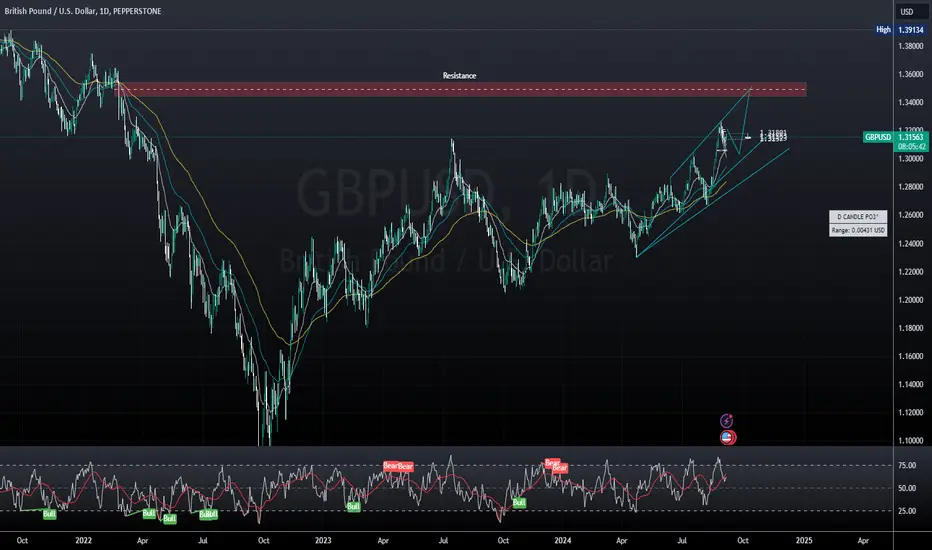
The daily chart for GBP/USD reveals a clear uptrend with price action forming a bullish channel. The pair is currently trading around 1.31621, approaching a critical resistance zone.
Key Levels:
Resistance Zone:
The price is heading towards a major resistance around 1.39, a level which has historically acted as a strong ceiling. This resistance could halt the upward movement unless a significant breakout occurs.
Support Levels:
The lower trendline of the channel is acting as dynamic support. If the price retraces, the 1.30 level should provide a cushion for potential buying pressure, maintaining the bullish trend.
Trading Strategy:
Buying Strategy:
Traders can look for a pullback to the lower boundary of the channel around 1.30 for a potential buying opportunity. A stop loss can be placed just below the trendline, targeting the resistance at 1.39.
Breakout Strategy:
A breakout above the 1.39 resistance would signal a continuation of the long-term bullish trend, opening up the possibility for further gains toward higher resistance levels.
RSI Confirmation:
The RSI indicator is approaching overbought territory but still has room to push higher. This suggests that the bullish momentum could continue until resistance is tested.
Conclusion:
With GBP/USD trading within a rising channel, the focus remains on how the price interacts with the 1.39 resistance level. A pullback to the lower trendline offers buying opportunities, while a breakout above resistance would signal further bullish potential.
相關出版品
免責聲明
這些資訊和出版物並不意味著也不構成TradingView提供或認可的金融、投資、交易或其他類型的意見或建議。請在使用條款閱讀更多資訊。