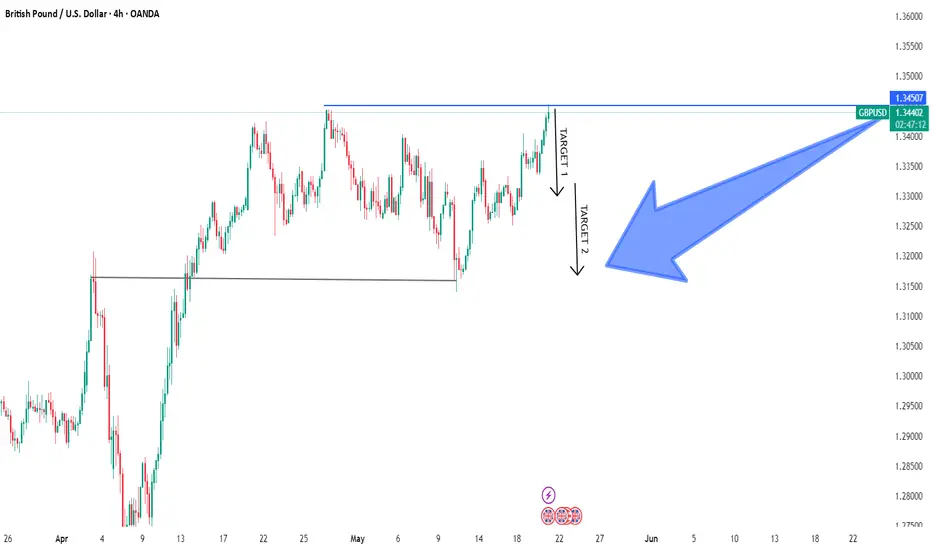
We are analyzing a GBP/USD 4-hour chart, and have marked potential sell targets with the labels:
Target 1 – around the 1.3350 area
Target 2 – closer to the 1.3220–1.3250 range
Stop loss - at 1.35200
Here's a quick breakdown of what the chart seems to indicate:
Current Price: 1.34254
Sell Zone: It looks like the pair is reacting from a resistance level near 1.34500.
Target 1: A minor support level, likely a short-term profit-taking zone.
Target 2: A deeper retracement zone, possibly aligning with a prior demand zone or consolidation area.
This setup implies we are expecting a rejection or reversal from resistance for a short trade.
免責聲明
這些資訊和出版物並不意味著也不構成TradingView提供或認可的金融、投資、交易或其他類型的意見或建議。請在使用條款閱讀更多資訊。
免責聲明
這些資訊和出版物並不意味著也不構成TradingView提供或認可的金融、投資、交易或其他類型的意見或建議。請在使用條款閱讀更多資訊。