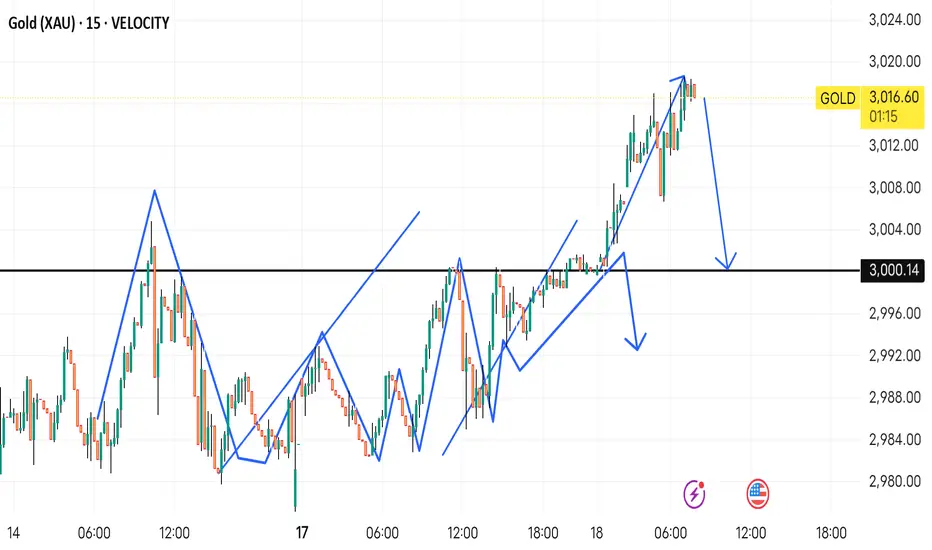
This chart is a 15-minute Gold (XAU/USD) price analysis with a technical pattern projection.
Key Observations:
1. Support & Resistance:
A strong horizontal support level is marked at $3,000.14.
Price recently peaked near $3,016.13 and is showing signs of a potential reversal.
2. Price Structure & Pattern:
The blue lines indicate wave-like price movements, possibly an Elliott Wave or price action structure.
The pattern suggests that the market previously experienced a strong bullish impulse, but now a retracement is expected.
3. Projected Movement:
The downward arrows suggest a bearish correction towards $3,000.14, which could act as a key support zone.
If price respects this support, a potential bounce-back might occur. Otherwise, a breakdown could lead to further declines.
Possible Trading Plan:
Short Setup: If price starts rejecting resistance near $3,016 and forms bearish confirmation (e.g., candlestick patterns like engulfing or pin bars).
Buy Opportunity: If price reaches $3,000.14 and shows strong support confirmation (like a bullish engulfing or double bottom).
Would you like a more detailed trading plan based on this setup?
免責聲明
這些資訊和出版物並不意味著也不構成TradingView提供或認可的金融、投資、交易或其他類型的意見或建議。請在使用條款閱讀更多資訊。
免責聲明
這些資訊和出版物並不意味著也不構成TradingView提供或認可的金融、投資、交易或其他類型的意見或建議。請在使用條款閱讀更多資訊。