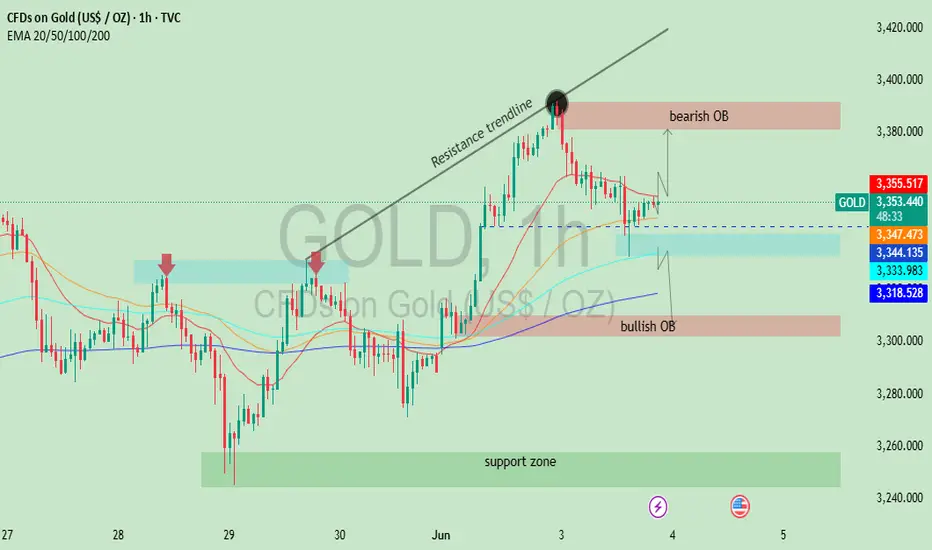
This chart shows the 1-hour (1H) price action for **Gold (XAU/USD)** as of **June 3, 2025**. It incorporates key technical indicators and price zones relevant for short-term trading or analysis. Here's a detailed breakdown:
---
### 📈 **Chart Components and Analysis**
#### 1. **Trendline & Price Action**
* A **resistance trendline** is drawn connecting recent higher highs, indicating a bearish breakout when price rejected the upper trend.
* Price spiked above the trendline briefly but sharply reversed from a key area, suggesting **strong seller pressure** near the recent highs (\~\$3,400).
#### 2. **Order Blocks (OBs)**
* **Bearish OB (Order Block)**: Located just below the \$3,400 level. This zone marks a strong supply area where institutional selling likely occurred, leading to the recent drop.
* **Bullish OB**: Around the \$3,320–\$3,340 zone. This represents a demand area where buyers previously stepped in, possibly creating a support base.
#### 3. **Support Zone**
* A **broad support zone** is shown in green between approximately **\$3,250 and \$3,270**.
* This zone was tested previously and held firm, suggesting potential for bullish activity if price retraces deeply.
#### 4. **Moving Averages (EMA 20/50/100/200)**
* The EMAs are color-coded:
* **20 EMA**: \$3,355.466 (red)
* **50 EMA**: \$3,347.451 (orange)
* **100 EMA**: \$3,333.973 (cyan)
* **200 EMA**: \$3,318.522 (blue)
* Price is currently trading between the 20 and 50 EMA, indicating a potential decision point (either breakout or pullback).
#### 5. **Price Scenarios**
* Two potential scenarios are drawn with arrows:
* **Bullish Scenario**: Price bounces from the blue highlighted zone (minor demand) and targets the bearish OB.
* **Bearish Scenario**: Price breaks down through the minor support and heads toward the **bullish OB** or **support zone**.
---
### 🧭 **Trading Implication**
* **Short-term Bias**: Neutral to Bearish unless price reclaims and holds above \$3,355 (20 EMA).
* **Key Levels to Watch**:
* Resistance: \$3,380–\$3,400 (bearish OB)
* Support: \$3,340–\$3,320 (bullish OB), then deeper at \$3,250–\$3,270
---
Would you like this analysis updated for future movements, or should I generate trading signals based on this setup?
---
### 📈 **Chart Components and Analysis**
#### 1. **Trendline & Price Action**
* A **resistance trendline** is drawn connecting recent higher highs, indicating a bearish breakout when price rejected the upper trend.
* Price spiked above the trendline briefly but sharply reversed from a key area, suggesting **strong seller pressure** near the recent highs (\~\$3,400).
#### 2. **Order Blocks (OBs)**
* **Bearish OB (Order Block)**: Located just below the \$3,400 level. This zone marks a strong supply area where institutional selling likely occurred, leading to the recent drop.
* **Bullish OB**: Around the \$3,320–\$3,340 zone. This represents a demand area where buyers previously stepped in, possibly creating a support base.
#### 3. **Support Zone**
* A **broad support zone** is shown in green between approximately **\$3,250 and \$3,270**.
* This zone was tested previously and held firm, suggesting potential for bullish activity if price retraces deeply.
#### 4. **Moving Averages (EMA 20/50/100/200)**
* The EMAs are color-coded:
* **20 EMA**: \$3,355.466 (red)
* **50 EMA**: \$3,347.451 (orange)
* **100 EMA**: \$3,333.973 (cyan)
* **200 EMA**: \$3,318.522 (blue)
* Price is currently trading between the 20 and 50 EMA, indicating a potential decision point (either breakout or pullback).
#### 5. **Price Scenarios**
* Two potential scenarios are drawn with arrows:
* **Bullish Scenario**: Price bounces from the blue highlighted zone (minor demand) and targets the bearish OB.
* **Bearish Scenario**: Price breaks down through the minor support and heads toward the **bullish OB** or **support zone**.
---
### 🧭 **Trading Implication**
* **Short-term Bias**: Neutral to Bearish unless price reclaims and holds above \$3,355 (20 EMA).
* **Key Levels to Watch**:
* Resistance: \$3,380–\$3,400 (bearish OB)
* Support: \$3,340–\$3,320 (bullish OB), then deeper at \$3,250–\$3,270
---
Would you like this analysis updated for future movements, or should I generate trading signals based on this setup?
交易結束:目標達成
Target Achieved:The downward movement from the resistance zone to the support zone suggests that the short-term target mentioned in the title—"Eyes on Support Zone"—has been successfully achieved.
免責聲明
這些資訊和出版物並不意味著也不構成TradingView提供或認可的金融、投資、交易或其他類型的意見或建議。請在使用條款閱讀更多資訊。
免責聲明
這些資訊和出版物並不意味著也不構成TradingView提供或認可的金融、投資、交易或其他類型的意見或建議。請在使用條款閱讀更多資訊。