🔹Technical Analysis: Gold (XAU/USD) – 4-Hour Chart
▪️Market Structure & Trendline Break
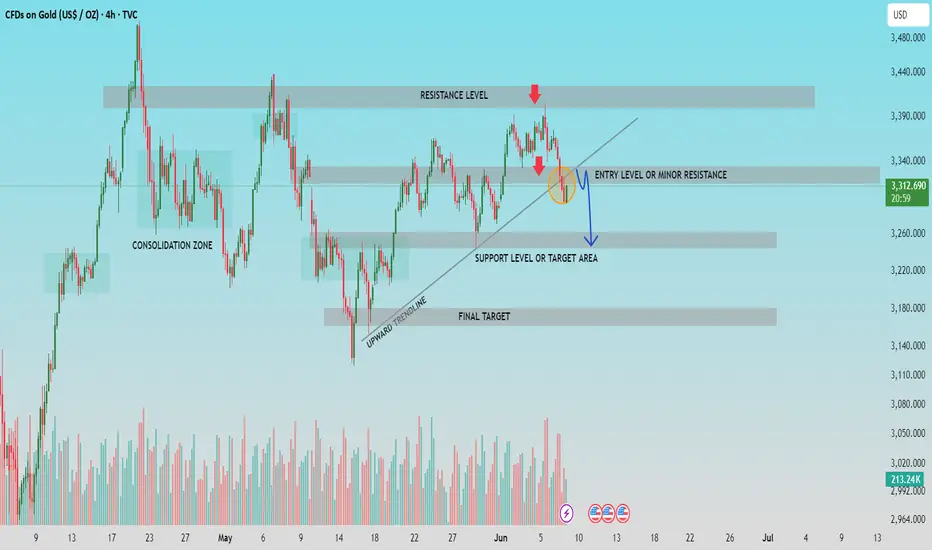
▫️ Price has broken below the upward trendline, indicating a potential shift in market sentiment from bullish to bearish.
▫️ The failure to sustain above the resistance level near $3,390-$3,440 led to a pullback and bearish rejection (marked by red arrows).
▪️Key Levels
▫️ Minor Resistance / Entry Level: $3,320-$3,340 area may now act as a resistance zone after the trendline break, providing a potential short entry level.
▫️ Support Level / First Target: $3,250-$3,270 zone is identified as the next major support and short-term target.
▫️ Final Target: A deeper correction could push price towards the $3,160-$3,180 region.
▪️Trade Outlook
▫️Current price action suggests a bearish outlook, with potential for a downward move from the minor resistance area.
▫️ Traders may look for sell opportunities on pullbacks into the $3,320-$3,340 zone with confirmation.
▪️Volume Analysis
▫️ Volume has spiked during the breakdown, indicating strong selling interest, supporting the case for downside continuation.
▫️Bias: Bearish, targeting lower support zones after trendline breakdown.
🔹Community Insight:
If you find this analysis helpful in your trading journey, feel free to share your thoughts or questions in the comments. Let’s work together to maintain a disciplined, technical approach to the markets.
▪️Follow for regular updates and trade setups.
▪️Market Structure & Trendline Break
▫️ Price has broken below the upward trendline, indicating a potential shift in market sentiment from bullish to bearish.
▫️ The failure to sustain above the resistance level near $3,390-$3,440 led to a pullback and bearish rejection (marked by red arrows).
▪️Key Levels
▫️ Minor Resistance / Entry Level: $3,320-$3,340 area may now act as a resistance zone after the trendline break, providing a potential short entry level.
▫️ Support Level / First Target: $3,250-$3,270 zone is identified as the next major support and short-term target.
▫️ Final Target: A deeper correction could push price towards the $3,160-$3,180 region.
▪️Trade Outlook
▫️Current price action suggests a bearish outlook, with potential for a downward move from the minor resistance area.
▫️ Traders may look for sell opportunities on pullbacks into the $3,320-$3,340 zone with confirmation.
▪️Volume Analysis
▫️ Volume has spiked during the breakdown, indicating strong selling interest, supporting the case for downside continuation.
▫️Bias: Bearish, targeting lower support zones after trendline breakdown.
🔹Community Insight:
If you find this analysis helpful in your trading journey, feel free to share your thoughts or questions in the comments. Let’s work together to maintain a disciplined, technical approach to the markets.
▪️Follow for regular updates and trade setups.
交易進行
from 3326註釋
trade running 140 pips+註釋
one more layer added from 3334, after candlestick confirmations , 註釋
註釋
after breakdown 3311level , trade activated here, 3311..targets are downside...
手動結束交易
in good pips like 420 💸FREE FOREX Signals in Telegram : t.me/FxInsightsHub0
🔹Join Our Telegram Channel, Pure Price Action Based Signals With Chart Analysis.
t.me/FxInsightsHub0
🚀FREE CRYPTO Signals In Telegram: t.me/FxInsightsHub0
🔹Join Our Telegram Channel, Pure Price Action Based Signals With Chart Analysis.
t.me/FxInsightsHub0
🚀FREE CRYPTO Signals In Telegram: t.me/FxInsightsHub0
相關出版品
免責聲明
這些資訊和出版物並不意味著也不構成TradingView提供或認可的金融、投資、交易或其他類型的意見或建議。請在使用條款閱讀更多資訊。
💸FREE FOREX Signals in Telegram : t.me/FxInsightsHub0
🔹Join Our Telegram Channel, Pure Price Action Based Signals With Chart Analysis.
t.me/FxInsightsHub0
🚀FREE CRYPTO Signals In Telegram: t.me/FxInsightsHub0
🔹Join Our Telegram Channel, Pure Price Action Based Signals With Chart Analysis.
t.me/FxInsightsHub0
🚀FREE CRYPTO Signals In Telegram: t.me/FxInsightsHub0
相關出版品
免責聲明
這些資訊和出版物並不意味著也不構成TradingView提供或認可的金融、投資、交易或其他類型的意見或建議。請在使用條款閱讀更多資訊。