1. Over-Reliance on Support Zone
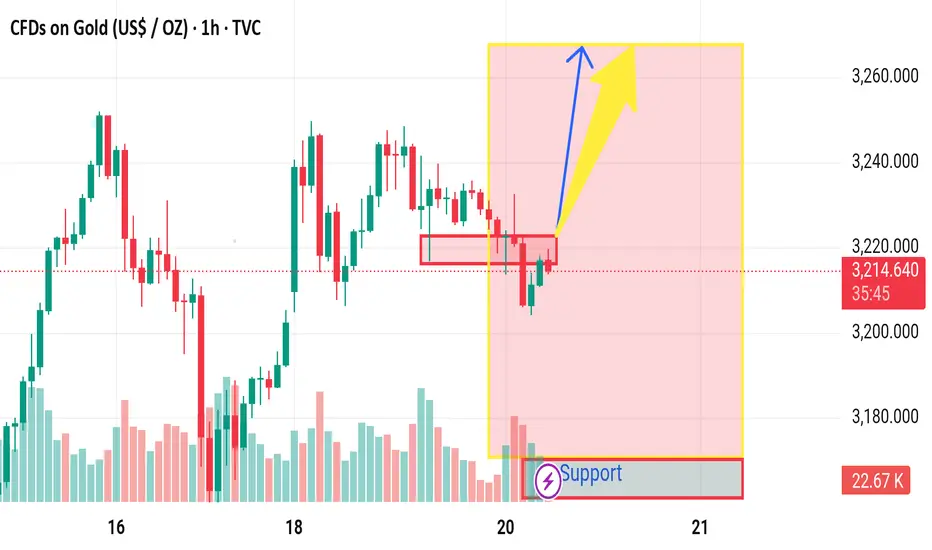
The analysis heavily leans on the assumption that the support zone (marked with the purple "Support" label) will hold.
However, this support has already been tested multiple times, which weakens its strength.
A break below this zone could trigger significant stop-loss hunting, leading to a bearish breakdown instead of a bullish reversal.
2. Volume Analysis Suggests Weak Momentum
The recent bounce lacks strong volume. This suggests that buying interest is not convincing at this level.
Without volume confirmation, any bullish move is less likely to sustain.
3. Lower Highs Pattern
Despite small rallies, the chart is forming lower highs, which is typically a bearish signal.
This hints at seller dominance, and the yellow bullish projection might be overly optimistic.
4. Resistance Overhead
The price is approaching a short-term resistance zone (red box), which has rejected the price previously.
Without a clear breakout above that, the bullish case is speculative.
5. Fundamental Factors Unaccounted
The chart doesn’t account for macro factors like U.S. dollar strength, interest rates, or geopolitical influences that often affect gold.
If the dollar strengthens, gold may drop, breaking the support.
t.me/gold_free_signals1
𝙁𝙤𝙧𝙚𝙭 𝙩𝙧𝙖𝙙𝙞𝙣𝙜 𝙚𝙭𝙥𝙚𝙧𝙞𝙚𝙣𝙘𝙚 𝙩𝙚𝙖𝙢 ☺️ 𝙢𝙖𝙣𝙖𝙜𝙚 𝙮𝙤𝙪𝙧 𝙖𝙘𝙘𝙤𝙪𝙣𝙩 𝙢𝙖𝙠𝙞𝙣𝙜 𝙢𝙤𝙣𝙚𝙮 🤑💰
t.me/gold_free_signals1
𝙁𝙤𝙧𝙚𝙭 𝙩𝙧𝙖𝙙𝙞𝙣𝙜 𝙚𝙭𝙥𝙚𝙧𝙞𝙚𝙣𝙘𝙚 𝙩𝙚𝙖𝙢 ☺️ 𝙢𝙖𝙣𝙖𝙜𝙚 𝙮𝙤𝙪𝙧 𝙖𝙘𝙘𝙤𝙪𝙣𝙩 𝙢𝙖𝙠𝙞𝙣𝙜 𝙢𝙤𝙣𝙚𝙮 🤑💰
t.me/gold_free_signals1
免責聲明
這些資訊和出版物並不意味著也不構成TradingView提供或認可的金融、投資、交易或其他類型的意見或建議。請在使用條款閱讀更多資訊。
t.me/gold_free_signals1
𝙁𝙤𝙧𝙚𝙭 𝙩𝙧𝙖𝙙𝙞𝙣𝙜 𝙚𝙭𝙥𝙚𝙧𝙞𝙚𝙣𝙘𝙚 𝙩𝙚𝙖𝙢 ☺️ 𝙢𝙖𝙣𝙖𝙜𝙚 𝙮𝙤𝙪𝙧 𝙖𝙘𝙘𝙤𝙪𝙣𝙩 𝙢𝙖𝙠𝙞𝙣𝙜 𝙢𝙤𝙣𝙚𝙮 🤑💰
t.me/gold_free_signals1
𝙁𝙤𝙧𝙚𝙭 𝙩𝙧𝙖𝙙𝙞𝙣𝙜 𝙚𝙭𝙥𝙚𝙧𝙞𝙚𝙣𝙘𝙚 𝙩𝙚𝙖𝙢 ☺️ 𝙢𝙖𝙣𝙖𝙜𝙚 𝙮𝙤𝙪𝙧 𝙖𝙘𝙘𝙤𝙪𝙣𝙩 𝙢𝙖𝙠𝙞𝙣𝙜 𝙢𝙤𝙣𝙚𝙮 🤑💰
t.me/gold_free_signals1
免責聲明
這些資訊和出版物並不意味著也不構成TradingView提供或認可的金融、投資、交易或其他類型的意見或建議。請在使用條款閱讀更多資訊。