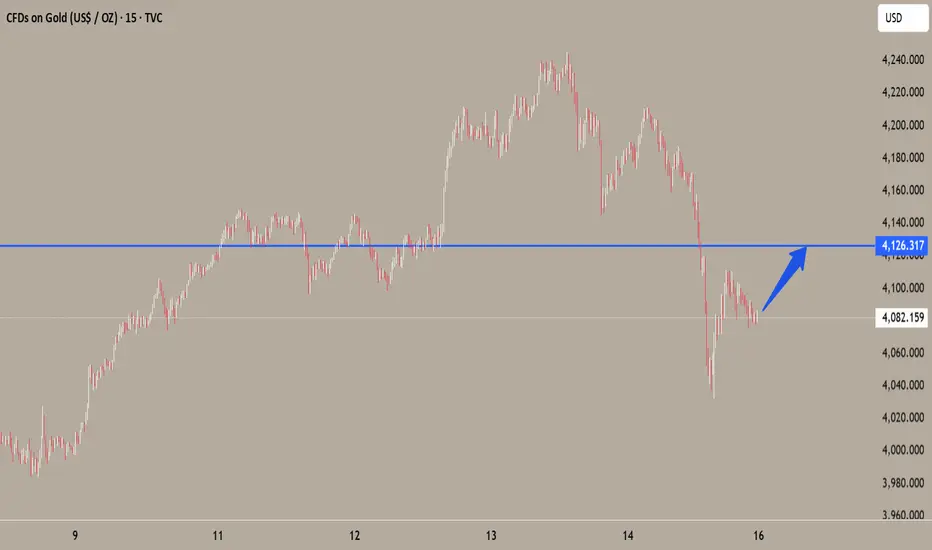
Important assumption (stated clearly): I do not have the image of your exact chart or the numeric value of the blue-line target, so this analysis assumes the blue-line target is above today’s spot level and represents a meaningful resistance/target on the weekly/monthly timeframe. If your target is below current price the technical story flips — tell me the exact value or upload the chart and I’ll adapt.
---
Executive summary — the short thesis
Gold’s move toward the blue-line target is plausible because three mutually reinforcing themes are in play:
1. Macro tailwinds (inflation persistence + lower real rates expectation → higher gold demand),
2. Structural demand (central bank buying + ETF/institutional accumulation), and
3. Technical breakout dynamics (momentum, volume confirmation, and common extension targets).
Each theme alone can push price higher; together they create a high-probability path to the blue line — but risks (real yield rebounds, USD strength, rapid risk-on reversals) can abort or delay the move.
---
1) Macro and policy drivers (why gold wants to be higher)
Real interest rates are the single most important macro control on gold. Lower or falling real yields reduce the opportunity cost of holding non-yielding gold, improving gold’s appeal as an inflation hedge. Markets are pricing a path toward easier policy (or lower terminal rates) and that compresses real yields — a pro-gold environment.
Inflation expectations and uncertainty remain elevated. Where inflation expectations stay sticky, investors and treasuries use gold as insurance. If headline or core inflation surprises on the upside, that directly supports continued buying.
Geopolitical & risk-off shocks amplify the move. Any escalation in geopolitical risk (trade tensions, regional conflicts) increases safe-haven demand and often triggers large, fast price jumps.
(Load-bearing facts for this section: central bank buying, inflation drivers, Fed expectations — see cited institutional and market commentary.)
---
2) Structural demand and flows (why the rally can be sustained)
Central banks continue to add to reserves. Persistent, sizeable purchases by official buyers create a structural bid that is different from short-term spec flows — it’s long-dated accumulation. That reduces available supply for investors and supports higher levels over months/years.
ETF and institutional flows are material. Record or heavy inflows into gold ETFs and funds add persistent buying pressure; large inflows can sustain rallies beyond purely technical breakouts.
Retail and seasonal physical demand can reinforce rallies. Jewelry seasons and retail demand (Asia, Middle East) often coincide with price momentum, adding a final push toward technical targets.
---
3) Technical structure — how price actually gets to the blue line
(I’m speaking generically because I don’t have the exact chart; apply these to your time frame — weekly or daily — whichever your blue line sits on.)
Breakout + retest dynamic: If price has broken a multi-week/month resistance (or important swing high) and then retested it successfully with rising volume, the path to the next measured target (often a measured move or Fibonacci extension) becomes much more likely. Traders and algos use these confirmations to add size.
Momentum and moving-average alignment: A stack of moving averages (e.g., 50 crossing above 200 — a "golden cross" on longer timeframes) plus rising RSI and MACD momentum supports an extended impulse leg toward the blue-line.
Volume & open interest: Increasing cash/spot volume and rising futures open interest on advances indicates real participation (not just short covering). That structural participation reduces the chance of a quick reversal and helps sustain a push toward obvious targets like your blue line.
Common extension targets: Traders commonly use Fibonacci extensions (127–161.8%), prior range height projections, or measured moves from consolidation to set the “blue line” style targets. If the blue line aligns with one of these projections, it gains legitimacy as a target because many actors place orders there.
---
4) Market structure and supply-side constraints
Physical mine supply is relatively inelastic short term. Mines can’t quickly add meaningful tonnage, so when demand surges, price adjusts more than quantity. Capital spending and long lead times for new production create upward pressure if demand remains strong.
Scrap supply is cyclical and price-sensitive. As prices rise, scrap supply can increase, capping upside — but that often lags price moves, letting gold run first then supply grow later.
---
5) Alternative scenarios — what would stop it
Real yields rebound fast: A surprise hawkish central bank reaction or unexpectedly strong employment/inflation data could push real yields higher and crush the rally.
US dollar strength returns: A sharp USD rally would subtract from USD-priced gold and can stop a run toward the blue line.
Flow exhaustion / profit taking: If ETF flows stall and positioning becomes one-sided, a volatility spike could trigger a fast unwind.
---
6) Probability framing & tactical checklist (how I’d watch it as an analyst)
High-probability signals that validate the path to the blue line:
Spot > key resistance with a clean retest and higher-than-average volume.
Open interest in futures rising alongside price (not diverging).
Continued central bank purchases / ETF inflows reported weekly.
Macro path: market pricing of Fed easing or lower terminal rates, or at least declining real yields.
Warning flags: real yields spike > 50–75 bps, USD index sharply higher, or a sudden halt/ reversal in ETF flows.
---
Concrete near-term scenarios (example probability splits, adapt to your time frame)
Base case (45–55%): Macros stay supportive, technical breakout consolidates — price reaches the blue line over several weeks. (Most likely if volume and flows continue.)
Bull case (20–25%): Macro shock (big geopolitical event or accelerating inflation surprise) causes an overshoot beyond the blue line — fast, big move.
Bear / failed breakout (25–35%): Real yields rebound or flows reverse; price fails to sustain above resistance and falls back to prior support.
---
Practical phrasing you can post under the chart (English, professional + share CTA)
> Market-leading analysis (professional):
The blue-line target is a natural extension of the current multi-month breakout. Macro conditions — persistent inflation expectations, lower real yields priced by markets, and ongoing central-bank accumulation — create a structural bid. Technically, a confirmed breakout with rising volume and expanding open interest will propel price toward the blue line; Fibonacci and measured-move projections align with this target, increasing its credibility. Counter-risks are a rapid rebound in real yields or a stronger USD, which would likely stop or reverse the move. This is an analysis, not investment advice — monitor real yields, ETF flows and the breakout retest for live confirmation.
Like and comment — tell me your view and what time-frame you want me to focus on.
---
Executive summary — the short thesis
Gold’s move toward the blue-line target is plausible because three mutually reinforcing themes are in play:
1. Macro tailwinds (inflation persistence + lower real rates expectation → higher gold demand),
2. Structural demand (central bank buying + ETF/institutional accumulation), and
3. Technical breakout dynamics (momentum, volume confirmation, and common extension targets).
Each theme alone can push price higher; together they create a high-probability path to the blue line — but risks (real yield rebounds, USD strength, rapid risk-on reversals) can abort or delay the move.
---
1) Macro and policy drivers (why gold wants to be higher)
Real interest rates are the single most important macro control on gold. Lower or falling real yields reduce the opportunity cost of holding non-yielding gold, improving gold’s appeal as an inflation hedge. Markets are pricing a path toward easier policy (or lower terminal rates) and that compresses real yields — a pro-gold environment.
Inflation expectations and uncertainty remain elevated. Where inflation expectations stay sticky, investors and treasuries use gold as insurance. If headline or core inflation surprises on the upside, that directly supports continued buying.
Geopolitical & risk-off shocks amplify the move. Any escalation in geopolitical risk (trade tensions, regional conflicts) increases safe-haven demand and often triggers large, fast price jumps.
(Load-bearing facts for this section: central bank buying, inflation drivers, Fed expectations — see cited institutional and market commentary.)
---
2) Structural demand and flows (why the rally can be sustained)
Central banks continue to add to reserves. Persistent, sizeable purchases by official buyers create a structural bid that is different from short-term spec flows — it’s long-dated accumulation. That reduces available supply for investors and supports higher levels over months/years.
ETF and institutional flows are material. Record or heavy inflows into gold ETFs and funds add persistent buying pressure; large inflows can sustain rallies beyond purely technical breakouts.
Retail and seasonal physical demand can reinforce rallies. Jewelry seasons and retail demand (Asia, Middle East) often coincide with price momentum, adding a final push toward technical targets.
---
3) Technical structure — how price actually gets to the blue line
(I’m speaking generically because I don’t have the exact chart; apply these to your time frame — weekly or daily — whichever your blue line sits on.)
Breakout + retest dynamic: If price has broken a multi-week/month resistance (or important swing high) and then retested it successfully with rising volume, the path to the next measured target (often a measured move or Fibonacci extension) becomes much more likely. Traders and algos use these confirmations to add size.
Momentum and moving-average alignment: A stack of moving averages (e.g., 50 crossing above 200 — a "golden cross" on longer timeframes) plus rising RSI and MACD momentum supports an extended impulse leg toward the blue-line.
Volume & open interest: Increasing cash/spot volume and rising futures open interest on advances indicates real participation (not just short covering). That structural participation reduces the chance of a quick reversal and helps sustain a push toward obvious targets like your blue line.
Common extension targets: Traders commonly use Fibonacci extensions (127–161.8%), prior range height projections, or measured moves from consolidation to set the “blue line” style targets. If the blue line aligns with one of these projections, it gains legitimacy as a target because many actors place orders there.
---
4) Market structure and supply-side constraints
Physical mine supply is relatively inelastic short term. Mines can’t quickly add meaningful tonnage, so when demand surges, price adjusts more than quantity. Capital spending and long lead times for new production create upward pressure if demand remains strong.
Scrap supply is cyclical and price-sensitive. As prices rise, scrap supply can increase, capping upside — but that often lags price moves, letting gold run first then supply grow later.
---
5) Alternative scenarios — what would stop it
Real yields rebound fast: A surprise hawkish central bank reaction or unexpectedly strong employment/inflation data could push real yields higher and crush the rally.
US dollar strength returns: A sharp USD rally would subtract from USD-priced gold and can stop a run toward the blue line.
Flow exhaustion / profit taking: If ETF flows stall and positioning becomes one-sided, a volatility spike could trigger a fast unwind.
---
6) Probability framing & tactical checklist (how I’d watch it as an analyst)
High-probability signals that validate the path to the blue line:
Spot > key resistance with a clean retest and higher-than-average volume.
Open interest in futures rising alongside price (not diverging).
Continued central bank purchases / ETF inflows reported weekly.
Macro path: market pricing of Fed easing or lower terminal rates, or at least declining real yields.
Warning flags: real yields spike > 50–75 bps, USD index sharply higher, or a sudden halt/ reversal in ETF flows.
---
Concrete near-term scenarios (example probability splits, adapt to your time frame)
Base case (45–55%): Macros stay supportive, technical breakout consolidates — price reaches the blue line over several weeks. (Most likely if volume and flows continue.)
Bull case (20–25%): Macro shock (big geopolitical event or accelerating inflation surprise) causes an overshoot beyond the blue line — fast, big move.
Bear / failed breakout (25–35%): Real yields rebound or flows reverse; price fails to sustain above resistance and falls back to prior support.
---
Practical phrasing you can post under the chart (English, professional + share CTA)
> Market-leading analysis (professional):
The blue-line target is a natural extension of the current multi-month breakout. Macro conditions — persistent inflation expectations, lower real yields priced by markets, and ongoing central-bank accumulation — create a structural bid. Technically, a confirmed breakout with rising volume and expanding open interest will propel price toward the blue line; Fibonacci and measured-move projections align with this target, increasing its credibility. Counter-risks are a rapid rebound in real yields or a stronger USD, which would likely stop or reverse the move. This is an analysis, not investment advice — monitor real yields, ETF flows and the breakout retest for live confirmation.
Like and comment — tell me your view and what time-frame you want me to focus on.
免責聲明
The information and publications are not meant to be, and do not constitute, financial, investment, trading, or other types of advice or recommendations supplied or endorsed by TradingView. Read more in the Terms of Use.
免責聲明
The information and publications are not meant to be, and do not constitute, financial, investment, trading, or other types of advice or recommendations supplied or endorsed by TradingView. Read more in the Terms of Use.