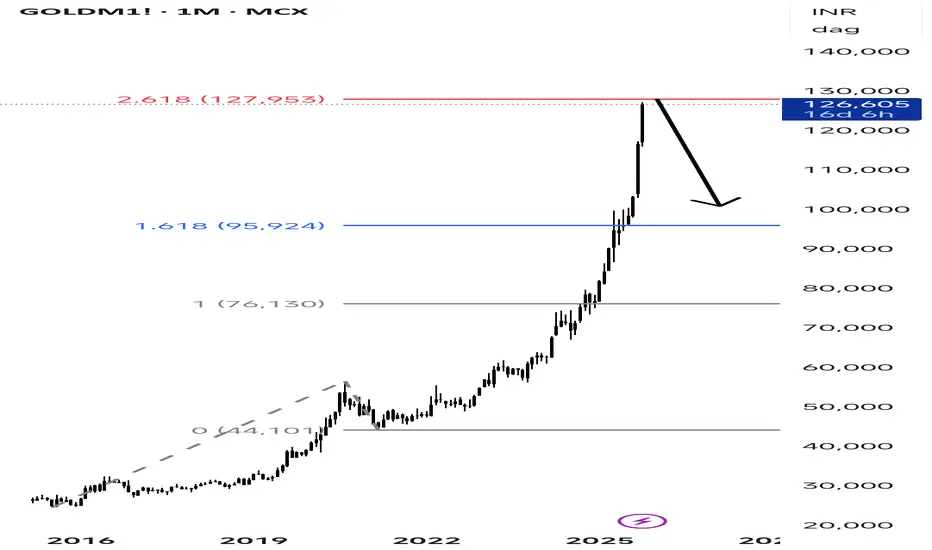
GOLDM1 (MCX) Monthly Fibonacci Extension Analysis The current price of GOLDM1 is around ■126,690. Using Fibonacci extension levels, we identify major resistance and reversal zones. The
1.618 Fibonacci level at ■95,924 has already been breached strongly, indicating strong bullish
momentum. However, the price is now approaching the 2.618 level at ■127,953, which ishistorically considered an exhaustion point in trending markets. At this stage, gold is likely to face
selling pressure or profit booking from major market participants. If the price fails to break above
■128,000 convincingly, a downward correction towards ■100,000 is highly probable, which aligns
with the previous Fibonacci support zone. Conclusion: GOLDM1 is in a parabolic rise but has
entered a high-probability reversal zone. A short-term correction towards ■100,000 may occur
unless ■128,000 is broken with high volume.
免責聲明
這些資訊和出版物並非旨在提供,也不構成TradingView提供或認可的任何形式的財務、投資、交易或其他類型的建議或推薦。請閱讀使用條款以了解更多資訊。