Setup Breakdown
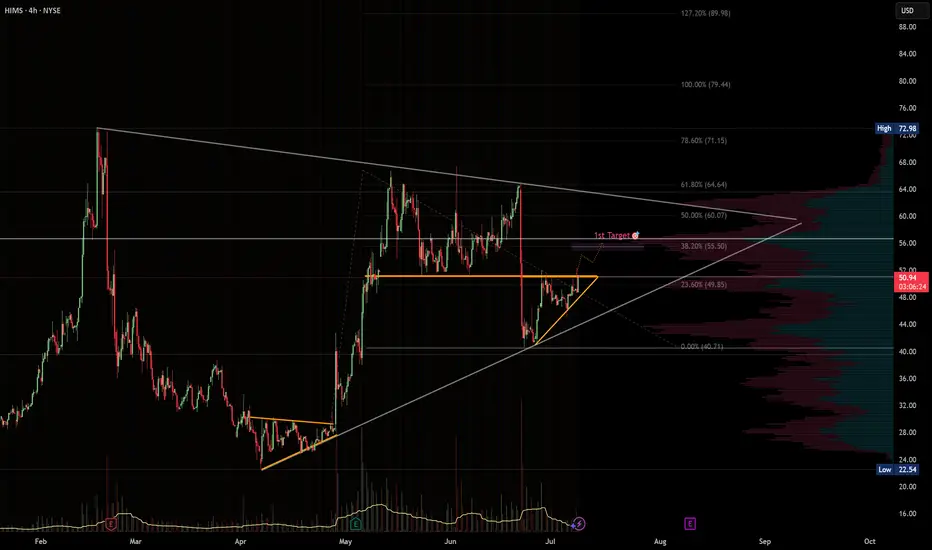
HIMS is forming a symmetrical triangle consolidation, with price tightening between rising support and descending resistance.
The structure follows a previous impulsive move, suggesting this is likely a bullish continuation pattern.
Volume is contracting — typical for pre-breakout setups — and price is holding above a key short-term rising trendline.
A breakout above $52–53 could initiate a fast move into the next resistance band.
---
🎯 Target Zone
🎯 Target Level Reason
Target-1 $55.50 (38.2% Fib) Volume gap fill + first resistance from prior consolidation range. A clean spot for partial profits.
Target-2 $60.00 (50% Fib) Strong historical resistance + Fibonacci confluence. Ideal level to take the rest of the position or trail a runner.
---
🛠️ Trade Plan (Example)
Component Action
Trigger Long on a confirmed breakout above $52 with volume ≥ 20-SMA
Entry Add-on Pullback retest of broken triangle resistance ($52) acting as new support
Stop-loss Close < $49.50 — invalidates the triangle
TP-1 $55.50 — take 50–70% off, move stop to breakeven
TP-2 $60.00 — exit or leave a small runner in case of further breakout
---
⚠️ Risk Notes
Earnings date approaching – trade may need to be closed or hedged before volatility spikes.
Break below $49.50 invalidates the pattern and opens risk to $46 or lower.
Watch for volume confirmation — fakeouts can occur if breakout lacks momentum.
---
✅ Checklist
[x] Triangle structure with strong trendline support
[x] Low-volume zone between $53–60 favors fast expansion
[x] Targets align with Fib + volume profile
[x] Risk clearly defined
[x] Earnings awareness in place
> Disclaimer: This is not financial advice. Trade your own plan and manage risk appropriately.
VM
免責聲明
這些資訊和出版物並不意味著也不構成TradingView提供或認可的金融、投資、交易或其他類型的意見或建議。請在使用條款閱讀更多資訊。
免責聲明
這些資訊和出版物並不意味著也不構成TradingView提供或認可的金融、投資、交易或其他類型的意見或建議。請在使用條款閱讀更多資訊。