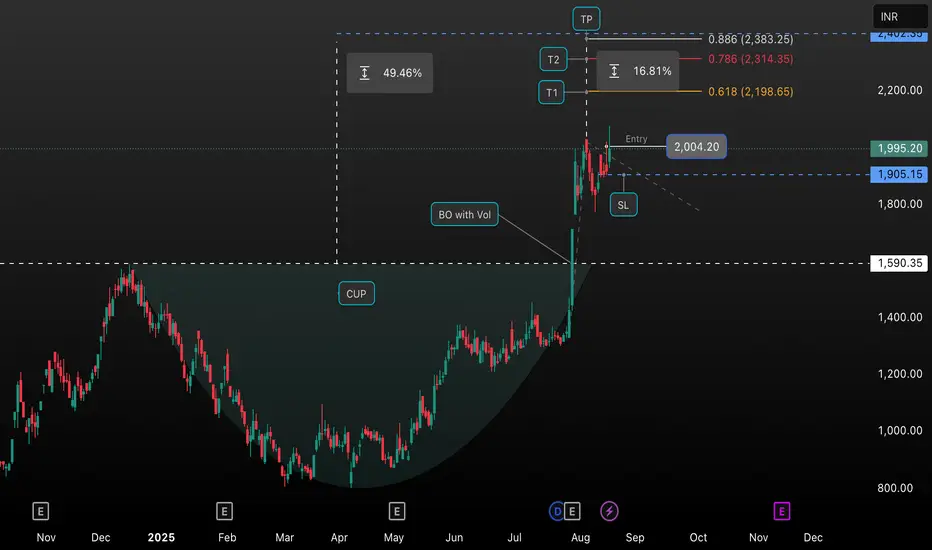
This chart illustrates a classic “Cup and Handle” breakout pattern on HIRECT, identified on the daily time frame. After forming a well-defined cup, the stock witnessed a significant breakout with increased volume (“BO with Vol”), signaling strong bullish momentum. Entry was triggered at ₹2,004.20, just above the handle resistance, with a suggested stop-loss (SL) below the breakout level at approximately ₹1,905.15.
The chart highlights multiple target zones (T1, T2, TP), based on Fibonacci extension levels and price action analysis:
• T1: 2,198.65 (61.8% Fibonacci extension)
• T2: 2,314.35 (78.6% extension)
• TP (Target Point): 2,383.25 (88.6% extension)
The setup indicates a potential upside move of about 49.46% from the cup base to the target point. To manage risk, the stop loss is set below breakout support. This setup is ideal for traders seeking a high-probability entry following a technical breakout pattern in a trending stock.
免責聲明
這些資訊和出版物並不意味著也不構成TradingView提供或認可的金融、投資、交易或其他類型的意見或建議。請在使用條款閱讀更多資訊。
免責聲明
這些資訊和出版物並不意味著也不構成TradingView提供或認可的金融、投資、交易或其他類型的意見或建議。請在使用條款閱讀更多資訊。