Pattern Overview
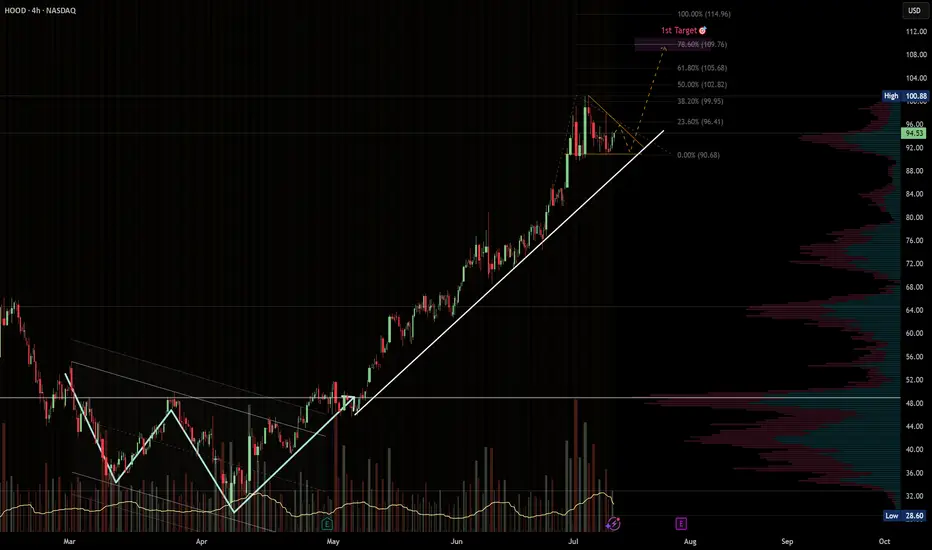
HOOD has been riding a strong ascending trendline since early May, respecting higher highs and higher lows all the way up.
After the most recent parabolic move from ~$90 to ~$101, price is now consolidating in a bullish pennant, just above key fib levels.
The setup looks primed for continuation if we see a breakout above $101 with confirming volume.
---
🎯 Target Zones
🎯 Target Level Why It Matters
Target 1 $109.76 78.6% Fibonacci extension from the previous leg. Common spot for intermediate take-profit. Also matches a soft VPVR resistance area.
Target 2 $114.96 100% measured-move projection of the prior rally. If momentum accelerates, this becomes a realistic stretch zone.
---
🛠️ Trade Plan (Example)
Component Level
Trigger Break and hold above $101 with volume ≥ 20-SMA.
Add-on Opportunity Pullback into $96–97 that respects the rising trendline.
Stop-loss Close < $92.5 invalidates trendline.
TP-1 $109–110 — take partials, move stop to breakeven.
TP-2 $114–115 — full exit or runner trail zone.
---
⚠️ Risk Notes
Watch for false breakouts — confirmation needs volume and price stability above $101.
Earnings or macro news could override technicals. Use tighter stops ahead of event dates.
If trendline fails, next key support sits at $89–90 (previous consolidation base).
---
✅ Trade Checklist
[x] Bullish trendline intact
[x] Continuation pennant forming
[x] Fib & measured move confluence at $109–115
[x] Volume profile supports clean move above $101
[x] Clear invalidation under $92
> Disclaimer: This is not financial advice. Always trade your own plan and manage risk appropriately.
VM
免責聲明
這些資訊和出版物並不意味著也不構成TradingView提供或認可的金融、投資、交易或其他類型的意見或建議。請在使用條款閱讀更多資訊。
免責聲明
這些資訊和出版物並不意味著也不構成TradingView提供或認可的金融、投資、交易或其他類型的意見或建議。請在使用條款閱讀更多資訊。