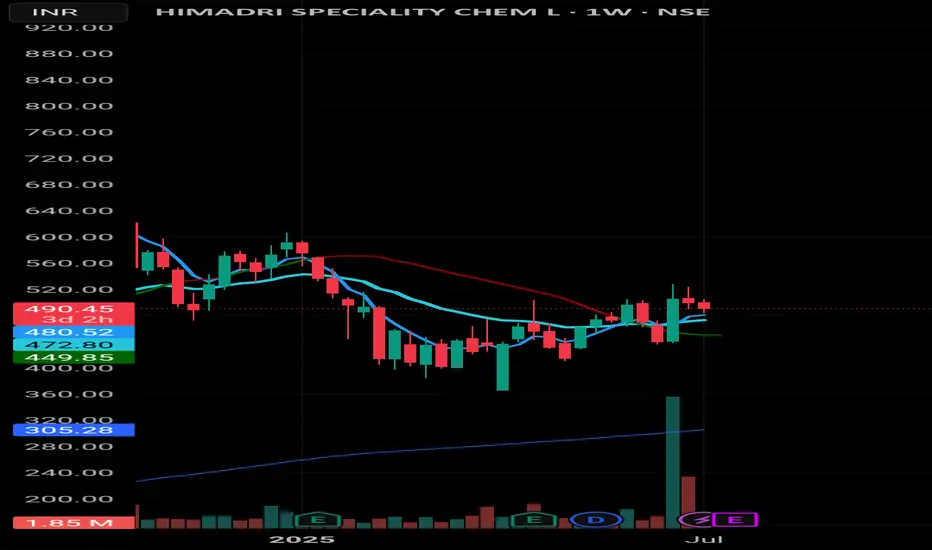
📊 Himadri Speciality Chem – Weekly Chart Update
• Strong volume breakout recently, with price hovering around 480–490 zone
• Price facing resistance near 200 EMA (red line) at ~487.70
• Support zones:
– 472.55 (20 EMA)
– 449.70 (50 EMA)
• Weekly candle formation hints at indecision. Watch next move for breakout or fade.
🎯 Plan Ahead:
If sustains above 488–490, potential upmove towards 520+
If breaks 472, expect retracement till 450–455 range
🔁 Trend is your friend, till it bends.
Not financial advice—just chart reading. Stay sharp. 💹
#Himadri #SwingTrade #PriceAction #VolumeBreakout #NSE #WeeklyAnalysis #TechnicalSetup
Started like everyone else — chasing trends, ignoring risk.
Learned the hard way that survival beats prediction.
Now I share structured equity views and hedged options plays using Renko and macro context — built for consistency, not dopamine.
Learned the hard way that survival beats prediction.
Now I share structured equity views and hedged options plays using Renko and macro context — built for consistency, not dopamine.
免責聲明
這些資訊和出版物並不意味著也不構成TradingView提供或認可的金融、投資、交易或其他類型的意見或建議。請在使用條款閱讀更多資訊。