Ticker:  IBIT – iShares Bitcoin Trust
Timeframe: 1D (Daily)
Current Price: $66.83
Bias: Bullish within ascending channel
Outlook: Continuation possible after Stoch RSI reset and trendline bounce
🧠 Idea Summary
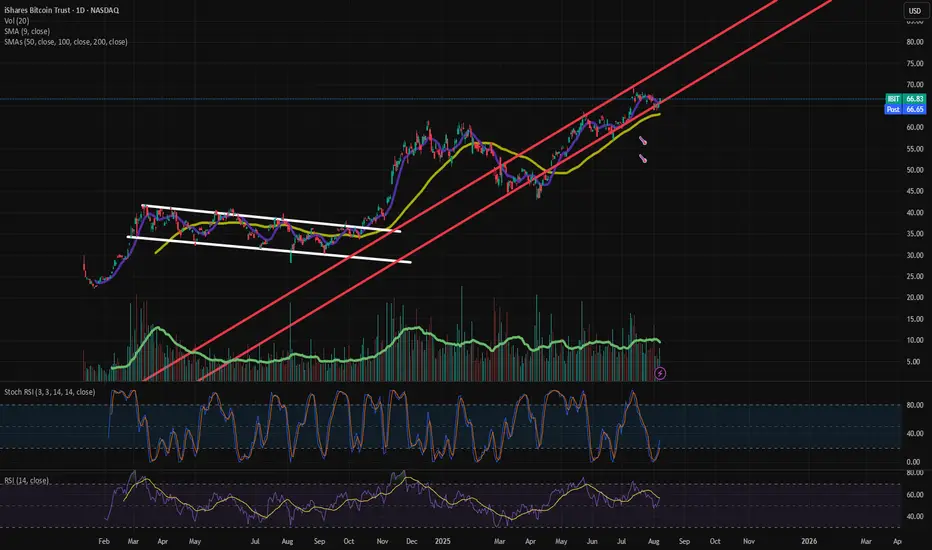
IBIT has been trading within a strong ascending channel (marked in red) since late 2023. After a brief consolidation near the channel midline, price is attempting a bounce from key support levels. This resembles the previous bullish flag breakout pattern (white lines) seen in mid-2023.
🔍 Technical Breakdown
📌 Red Ascending Channel
Price has followed a rising parallel channel since late 2023.
The current price is bouncing from the lower bound of this channel.
📌 Previous Bull Flag (White)
In 2023, IBIT broke out of a long consolidation channel with a strong rally — the current structure is mirroring that behavior.
📌 Support/Resistance Levels
🔶 Support: ~$63 (200 SMA)
🔶 Resistance: ~$70 (channel top)
Holding above $63 maintains the bullish structure.
📈 Moving Averages
9 SMA and 50 SMA are both sloping upward, suggesting bullish strength.
Price is currently holding above both, a positive sign for continuation.
🔄 Momentum Indicators
Stoch RSI: Rebounding from oversold (~19), indicating a potential fresh upside leg
RSI (14): Hovering near 57 — still has room to run before overbought territory
📊 Volume
Volume has been consistent with bullish moves, but a breakout above $70 should ideally be accompanied by a volume spike.
🚀 Potential Price Targets
🎯 Target 1: $70 (Channel top & psychological resistance)
🚀 Target 2: $75+ (Channel extension if momentum picks up)
⚠️ Risk Management
A breakdown below $63 and the lower trendline would invalidate the bullish channel and signal a potential trend shift.
Watch for volume divergence or failed follow-through on bullish setups.
🔔 Conclusion
IBIT is respecting technical structure and preparing for a possible continuation move. The recent bounce off the lower trendline, supported by Stoch RSI reset, offers a compelling long setup if momentum follows through. Keep an eye on $70 for breakout confirmation.
✅ Like this idea if you find it useful
💬 Share your thoughts or levels below
📌 Follow me for more crypto/ETF swing setups
Timeframe: 1D (Daily)
Current Price: $66.83
Bias: Bullish within ascending channel
Outlook: Continuation possible after Stoch RSI reset and trendline bounce
🧠 Idea Summary
IBIT has been trading within a strong ascending channel (marked in red) since late 2023. After a brief consolidation near the channel midline, price is attempting a bounce from key support levels. This resembles the previous bullish flag breakout pattern (white lines) seen in mid-2023.
🔍 Technical Breakdown
📌 Red Ascending Channel
Price has followed a rising parallel channel since late 2023.
The current price is bouncing from the lower bound of this channel.
📌 Previous Bull Flag (White)
In 2023, IBIT broke out of a long consolidation channel with a strong rally — the current structure is mirroring that behavior.
📌 Support/Resistance Levels
🔶 Support: ~$63 (200 SMA)
🔶 Resistance: ~$70 (channel top)
Holding above $63 maintains the bullish structure.
📈 Moving Averages
9 SMA and 50 SMA are both sloping upward, suggesting bullish strength.
Price is currently holding above both, a positive sign for continuation.
🔄 Momentum Indicators
Stoch RSI: Rebounding from oversold (~19), indicating a potential fresh upside leg
RSI (14): Hovering near 57 — still has room to run before overbought territory
📊 Volume
Volume has been consistent with bullish moves, but a breakout above $70 should ideally be accompanied by a volume spike.
🚀 Potential Price Targets
🎯 Target 1: $70 (Channel top & psychological resistance)
🚀 Target 2: $75+ (Channel extension if momentum picks up)
⚠️ Risk Management
A breakdown below $63 and the lower trendline would invalidate the bullish channel and signal a potential trend shift.
Watch for volume divergence or failed follow-through on bullish setups.
🔔 Conclusion
IBIT is respecting technical structure and preparing for a possible continuation move. The recent bounce off the lower trendline, supported by Stoch RSI reset, offers a compelling long setup if momentum follows through. Keep an eye on $70 for breakout confirmation.
✅ Like this idea if you find it useful
💬 Share your thoughts or levels below
📌 Follow me for more crypto/ETF swing setups
免責聲明
The information and publications are not meant to be, and do not constitute, financial, investment, trading, or other types of advice or recommendations supplied or endorsed by TradingView. Read more in the Terms of Use.
免責聲明
The information and publications are not meant to be, and do not constitute, financial, investment, trading, or other types of advice or recommendations supplied or endorsed by TradingView. Read more in the Terms of Use.