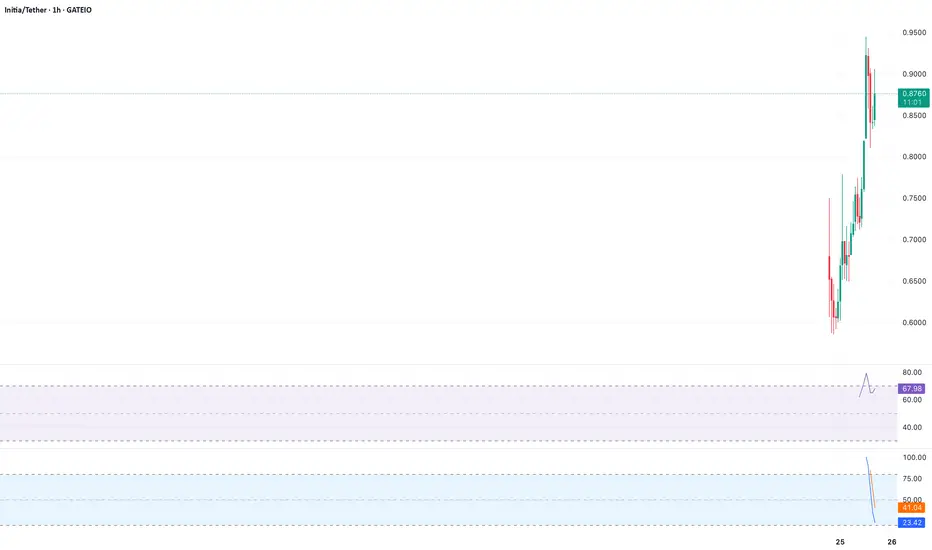
Analysis:  INIT is testing the $0.85 resistance level after a strong bounce from the $0.75 support, forming a bullish ascending triangle on the 4H chart. The RSI is at 60, indicating room for upward momentum, and the MACD shows a bullish crossover. A break above $0.87 could target $0.95, with strong volume supporting the move. Set a stop-loss below $0.80 to manage risk.
Key Levels: Resistance: $0.87, $0.95 | Support: $0.80, $0.75
Indicators: RSI (60), MACD (Bullish), Volume (Increasing)
Key Levels: Resistance: $0.87, $0.95 | Support: $0.80, $0.75
Indicators: RSI (60), MACD (Bullish), Volume (Increasing)
免責聲明
這些資訊和出版物並不意味著也不構成TradingView提供或認可的金融、投資、交易或其他類型的意見或建議。請在使用條款閱讀更多資訊。