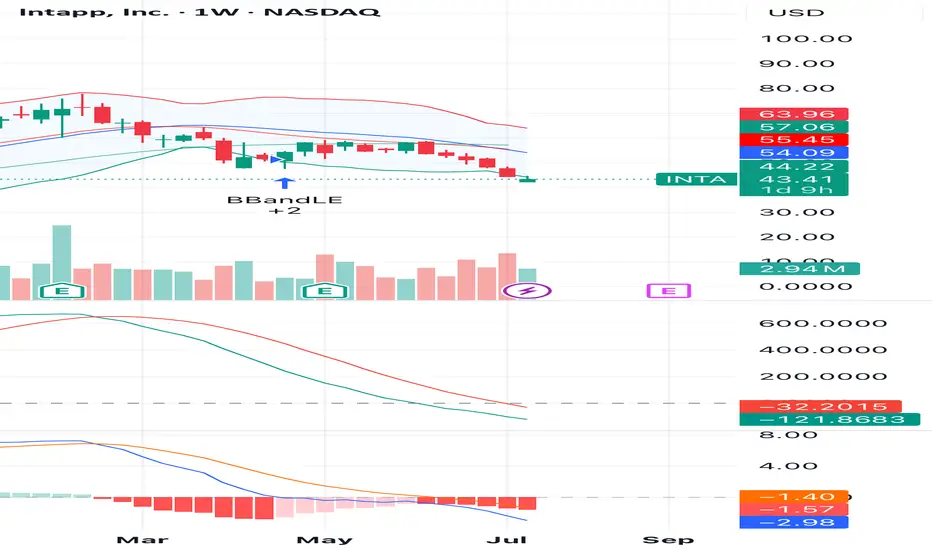
INTA is showing signs of a potential reversal after a consistent downtrend. On the weekly chart, the price touched the lower Bollinger Band with increased buying volume and a bullish candle forming. This may signal the end of the selling pressure.
Momentum indicators such as MACD and KST are flattening, suggesting a possible shift in momentum. A break above $44.22 could confirm a short-term bounce.
📈 Entry Zone: $43.00 – $44.50
🎯 Target 1: $54.00
🎯 Target 2: $57.00
🛑 Stop Loss: Below $41.00
This idea is based on technical signals; monitor volume and market conditions closely.
免責聲明
The information and publications are not meant to be, and do not constitute, financial, investment, trading, or other types of advice or recommendations supplied or endorsed by TradingView. Read more in the Terms of Use.
免責聲明
The information and publications are not meant to be, and do not constitute, financial, investment, trading, or other types of advice or recommendations supplied or endorsed by TradingView. Read more in the Terms of Use.