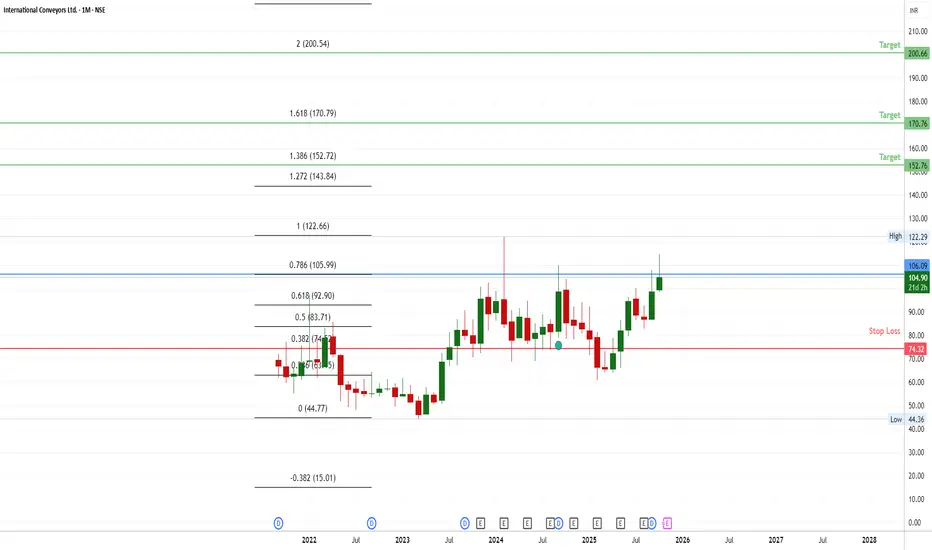
📌 Current Level: 105 (0.786 Fibonacci)
The market is hovering near this critical resistance level. A break above could signal bullish momentum.
📌 Upside Targets: 150 / 170 / 200
If the level of 105 is breached, these are the key retracement levels where price may find resistance next.
📌 Stop Loss: 74 (0.382 Fibonacci)
If the market reverses and falls below this level, it indicates a potential bearish move, making this a safe exit point.
免責聲明
這些資訊和出版物並不意味著也不構成TradingView提供或認可的金融、投資、交易或其他類型的意見或建議。請在使用條款閱讀更多資訊。
免責聲明
這些資訊和出版物並不意味著也不構成TradingView提供或認可的金融、投資、交易或其他類型的意見或建議。請在使用條款閱讀更多資訊。